I Got My Child’s NWEA MAP Growth Score Report and They are Below Grade Level. Now What?
I Got My Child’s MAP Growth Score Report and They Are Below Grade Level. Now What?
By Stephanie Smith, M.Ed. · Updated 2026 · 9 min read
Read the Report
Was It a Bad Day
Talk to the Teacher
Free Resources
Understanding Growth
What to Expect
Jump to any section. Reading time approximately 9 minutes.
If you have received your child’s MAP Growth report and felt your stomach drop at the words “below average” or a percentile in the 20s or 30s, I want you to stop and read this before you do anything else. I have spent 18 years working with assessment data in schools, and MAP Growth is the assessment I have seen parents misread more than any other. Not because the report is poorly designed – it is actually excellent. But because it contains information that looks alarming when you do not know how to read it, and looks much more manageable once you do.
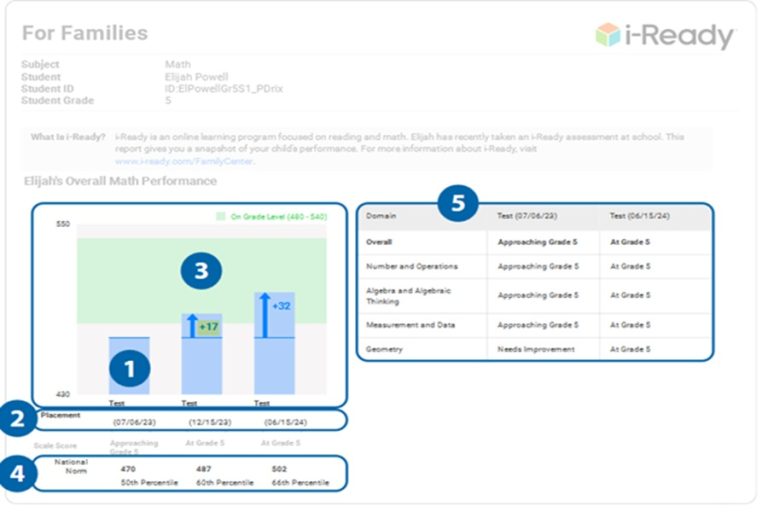
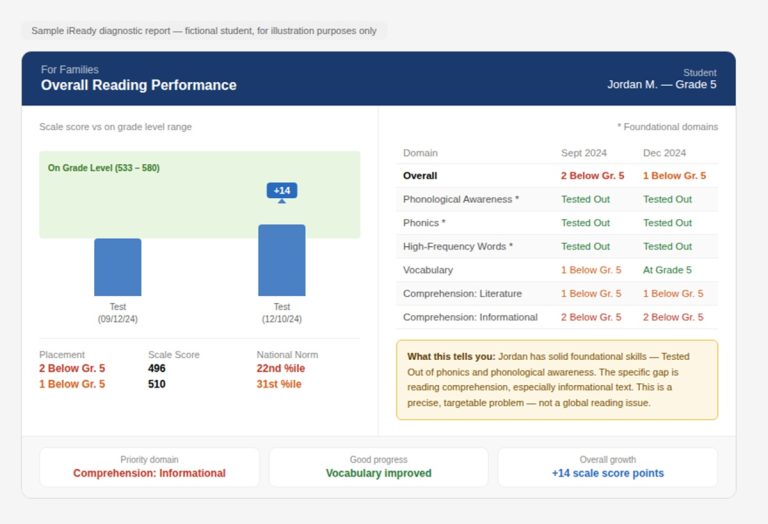
MAP Growth is different from iReady and different from state tests. It measures two things simultaneously – where your child is right now, and how fast they are growing. Both matter. A parent who only looks at the first number is missing half the picture. Let me show you how to read the whole thing.
What Is MAP Growth and How Does It Work?
MAP Growth stands for Measures of Academic Progress. It is a computer-adaptive assessment created by NWEA (Northwest Evaluation Association) and used by thousands of K-12 schools across the United States to measure student achievement and academic growth over time. Unlike a traditional test where every student gets the same questions, MAP Growth adapts in real time – if your child answers correctly, the next question gets harder. If they answer incorrectly, the next question becomes easier. The result is a precise measurement of exactly where each student is performing, regardless of their enrolled grade.
MAP Growth tests four subjects: Mathematics, Reading, Language Usage (starting from Grade 2), and Science (not available at every school or grade level). Each subject produces an overall score plus Goal Area scores showing performance in specific skill areas within that subject. Most schools administer MAP Growth three times per year – Fall, Winter, and Spring – though some schools test up to four times. The test is untimed and adaptive, typically taking 45 to 60 minutes per subject.
MAP Growth is used by schools as an official universal screener for RTI (Response to Intervention) and MTSS (Multi-Tiered System of Supports). This means a school using MAP data correctly is already supposed to be using low scores to trigger support decisions. That is important and I will come back to it. For the complete national norms tables and score charts see our NWEA MAP Test Scores guide.
Step 1: Read the Report Correctly – The Five Numbers That Matter
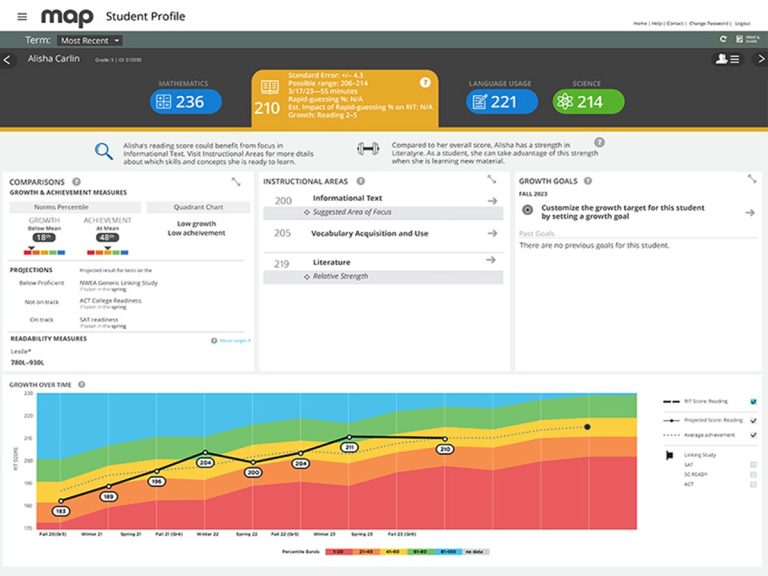
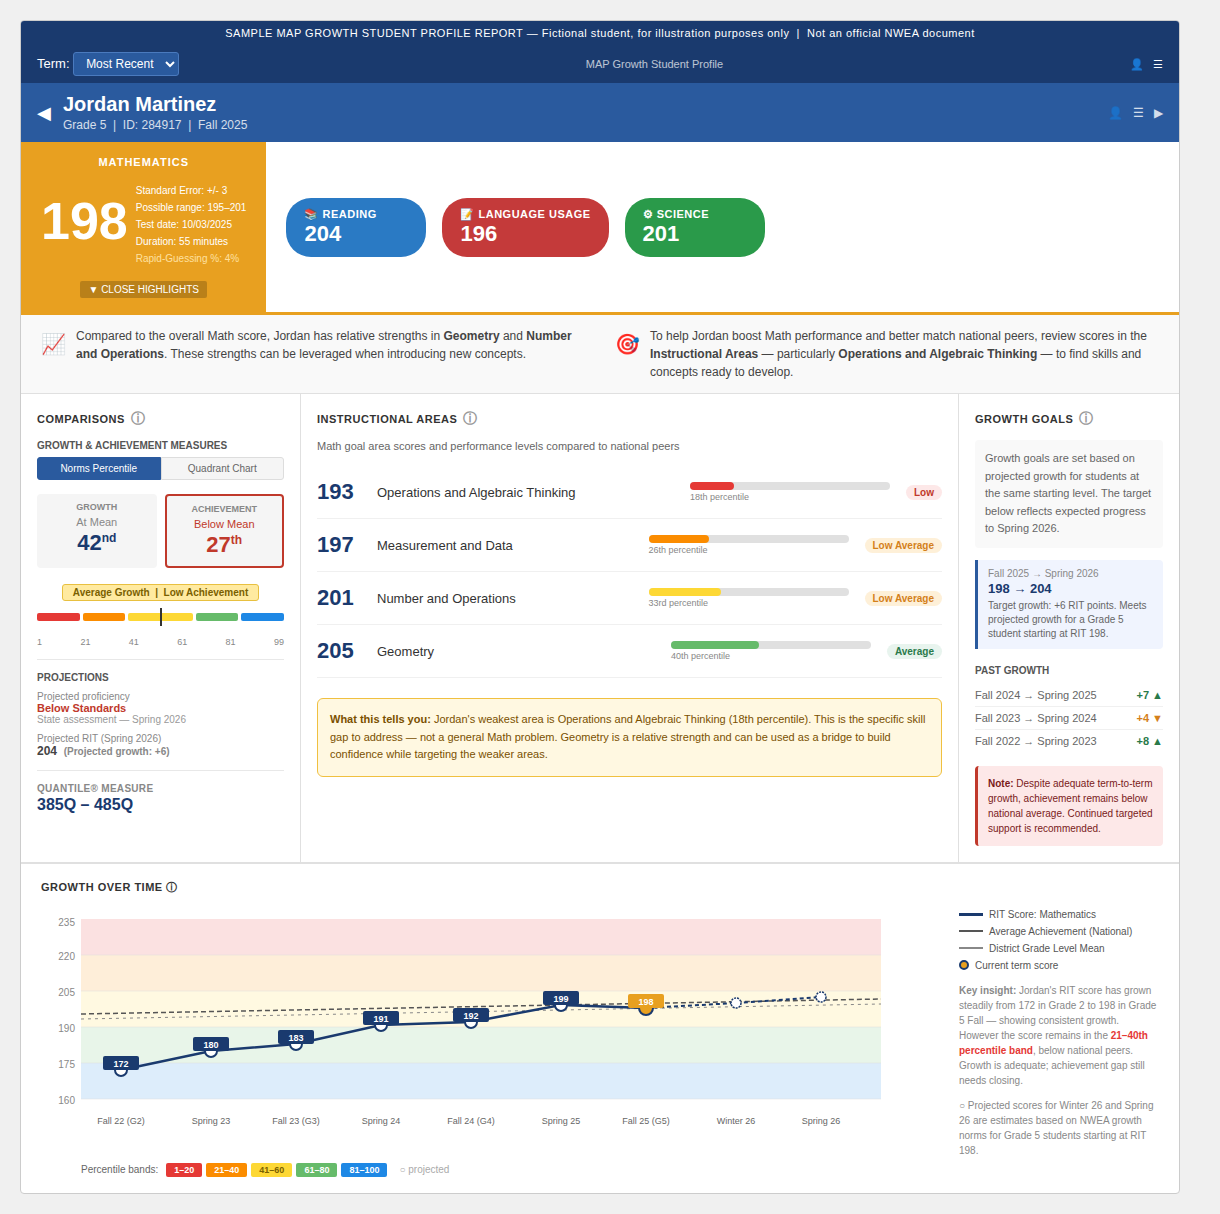
The MAP Growth report contains more information than most parents realize. Here are the five things you need to understand before drawing any conclusions.
1. The RIT Score. This is the primary number on the report. RIT stands for Rasch Unit and it is a grade-independent scale that runs from approximately 100 to 350 across all grades K-12. A RIT score of 210 in Math means the same thing whether the student is in Grade 3 or Grade 7 – it represents the same point on the learning continuum. This is fundamentally different from iReady which uses grade-based levels. Because the RIT scale does not change across grades, you can compare a student’s score from Fall to Winter to Spring across multiple years and see genuine growth on one consistent number.
2. The Percentile. This compares your child’s RIT score to a national sample of same-grade peers who tested in the same season. A 35th percentile score means your child outperformed 35% of same-grade students nationally. Remember: the 2025 norms update means these percentiles may look different from last year even if the RIT score is similar.
3. The Goal Area Scores. This is the subdomain breakdown and it is the most important section most parents skip entirely. In Math, goal areas typically include Operations and Algebraic Thinking, Number and Operations, Geometry, and Measurement and Data. In Reading, goal areas include Literary Text and Informational Text. A child who is overall “below average” in Math may be perfectly fine in Operations but specifically weak in Geometry. That is a precise, targetable problem – not a global Math issue. Find this section before you do anything else.
4. Projected Growth. This is the number of RIT points NWEA expected your child to grow between the last test and this one, based on what students at the same grade and starting RIT score typically achieve. This number is derived from national norms data across millions of students.
5. Observed Growth vs Projected Growth. This comparison is unique to MAP and does not exist in iReady. It tells you whether your child grew more, less, or exactly as much as expected given where they started. A child who is below the 50th percentile overall but whose Observed Growth exceeds Projected Growth is doing something right – they are closing the gap. A child who is at the 60th percentile but whose Observed Growth is consistently below Projected Growth has a developing concern that a single percentile number would never reveal.
The Lexile Range – Use It Today
MAP Reading reports include a Lexile range – a specific reading difficulty band your child can comfortably access. This is one of the most practically useful pieces of information on the entire report and most parents never use it. Go to hub.lexile.com/find-a-book right now, enter your child’s Lexile range, and find books at the right level. Reading volume at the right difficulty level is one of the most evidence-supported ways to improve both reading skill and MAP Reading scores. The Lexile range tells you exactly what that level is – use it.
Before You Worry Too Much: Was It a Bad Day?
MAP Growth is adaptive and untimed. That means a student who loses focus, rushes, or clicks randomly for even a few minutes can send the algorithm in the wrong direction and produce a score that does not reflect their actual ability. This is the same risk as iReady and it is real.
Things that can produce an inaccurate MAP Growth result without any underlying learning problem:
- Rushing through the test to finish quickly – very common in students who find sitting still difficult
- Testing anxiety – the adaptive difficulty increase can feel alarming to some children who then disengage
- Illness, poor sleep, or low energy on testing day
- Classroom distractions or noise during the session
- Testing later in the afternoon when concentration is lower
- Comparing current results to last year without accounting for the 2025 norms update – the same RIT score may now show a different percentile
MAP Growth is shorter per subject than iReady and generally does not carry the same two-hour total testing fatigue risk. But disengagement is still a genuine concern, particularly for younger students and for students who do not understand why they are taking the test or what it means for them.
One result that seems inconsistent with your child’s classroom performance is worth raising with the teacher directly. Ask: did anything seem off during the testing session? Was the student unwell, distracted, or unusually rushed? In many cases a teacher can request a re-test or simply wait for the next scheduled testing window to get a cleaner data point.
Could This Indicate a Learning Difference?
NWEA officially positions MAP Growth as a tool for RTI and MTSS universal screening – meaning schools are supposed to use persistent low MAP scores as one signal that a student may need evaluation for a learning difference. But one low result is not evidence of anything. The pattern across multiple testing windows is what matters.
If your child’s MAP Reading scores are consistently low across two or more years and particularly if the Observed Growth is also consistently below Projected Growth despite targeted support, that is a pattern worth taking seriously. Ask the teacher about a formal evaluation referral through the school’s Child Study or Student Support Team process. You can request this in writing as a parent and the school is legally required to respond. One result does not warrant this conversation. A persistent multi-window pattern does.
Step 2: Contact the Teacher – Email or Meeting?
If your child’s RIT score is below average but their Observed Growth is meeting or exceeding Projected Growth: A brief email is appropriate. The child is moving in the right direction. You want to stay informed and connected, not alarmed.
If your child’s RIT score is significantly below average AND their Observed Growth is below Projected Growth: Request a meeting. Both the achievement level and the growth rate are concerning together – that warrants a real conversation, not an email exchange.
“Hi [Teacher name], I received [child’s name]’s MAP Growth results and wanted to connect with you. I can see their overall RIT score in [subject] is [score] and I noticed their Observed Growth was [below/at/above] the Projected Growth. I have a few questions I would love to discuss: which goal areas are the specific priority right now, what support is already in place at school, and what I can do at home that actually aligns with what you are working on. Would you be able to reply briefly, or would a short call or meeting work better? Thank you.”
Exactly What to Ask the Teacher
- Which goal areas are specifically weakest? Overall RIT is too broad to act on. You need the goal area breakdown.
- Is my child meeting Projected Growth even if the overall RIT is below average? This distinction matters enormously for understanding urgency.
- What intervention or small group support is already in place? MAP is an official RTI/MTSS screener – if scores are low, support should already be happening.
- What specific skills should I focus on at home right now? Not general practice – the exact goal area that needs the most attention.
- What does expected growth look like between now and the Spring MAP test? Ask for a RIT target so you have something concrete to measure against.
- Is there a reading specialist or math interventionist working with my child? If not, ask how to access that support.
- At what point would you recommend a formal evaluation? Worth asking directly if growth has been consistently below projected across multiple windows.
What the School Should Already Be Doing
Because NWEA officially positions MAP Growth as a universal RTI and MTSS screener, a school using it correctly is already supposed to be using low scores to inform tiered support decisions. If your child has consistently scored below the 25th percentile across multiple MAP windows and nobody has mentioned intervention support, ask directly: “Is my child currently receiving any Tier 2 or Tier 3 support through the school’s intervention program, and if not, what is the process to access it?” This is not a confrontational question. It is a reasonable one given what the test is designed to do.
Step 3: Free and Low-Cost Practice Resources Aligned to MAP
Because MAP Growth organizes skill gaps by goal area rather than grade level, the best practice resources are those that are also skill-organized rather than grade-organized. Here are the ones that actually work.
Khan Academy (free, khanacademy.org) – Organized by skill rather than strictly by grade, Khan Academy aligns well to MAP Math goal areas. Search by the specific skill area the teacher identified as weak – for example “Operations and Algebraic Thinking Grade 4” – and work through those lessons specifically rather than a whole grade level course.
IXL (ixl.com) – IXL is particularly well-suited to MAP because it is organized entirely by skill rather than grade level – which is exactly how MAP goal areas work. You can target the specific skill domains identified as weak in the goal area breakdown. Worth the subscription cost if the budget allows.
Lexile Find a Book (hub.lexile.com/find-a-book) – Use your child’s Lexile range from the MAP Reading report to find books at exactly the right reading level. Reading volume at the right level is one of the most consistently evidence-supported reading interventions available and this tool makes it simple.
ReadWorks (free, readworks.org) – Free informational and literary reading passages organized by Lexile level and grade. Excellent for targeting the specific goal areas (Literary Text vs Informational Text) that MAP identifies as weak.
CommonLit (free, commonlit.org) – Free literary texts with comprehension scaffolding. Well-aligned to the Literary Text goal area in MAP Reading. Good for Grade 3 and above.
Prodigy Math (free, prodigygame.com) – Game-based adaptive math practice that students find genuinely engaging. Less structured than IXL but much more motivating for reluctant learners. Good for consolidating skills already introduced rather than introducing new ones.
Khan Academy Kids (free) – For younger students in K-Grade 2 whose MAP scores identify early literacy and numeracy gaps.
Your public library and school librarian – Ask the librarian for books in your child’s specific Lexile range. This is the most underused resource available to every parent at no cost. Librarians know their collections and a good librarian will find books your child actually wants to read at exactly the right level.
Step 4: What Actually Helps at Home – By Subject and Goal Area
Fifteen to twenty minutes of targeted daily practice beats two hours on a weekend. Here is what to focus on based on which MAP subject and goal area is weak.
MAP Math – Operations and Algebraic Thinking: Daily practice with fact families, multiplication and division, and word problems that involve two or more steps. Khan Academy’s Operations strand by grade level is your best resource here. Real-world problems – calculating change, splitting costs, figuring out how many of something you need – reinforce operational thinking naturally.
MAP Math – Number and Operations (fractions, decimals): Use physical objects – measuring cups, folding paper, pizza. Fractions are conceptual before they are procedural. A child who understands why 1/2 equals 2/4 will handle fraction operations far better than one who has only memorized the steps.
MAP Math – Geometry: Drawing shapes, identifying properties of polygons, working with area and perimeter using graph paper. Geometry is often the goal area parents are least equipped to practice at home but it is also the most visual – YouTube geometry explainer videos are genuinely helpful here.
MAP Reading – Literary Text: Read together and discuss. Not just “what happened” but “why did the character do that,” “what does this tell us about who they are,” and “what is the author trying to say.” The analytical discussion after reading is more valuable than the reading itself for developing literary comprehension skills.
MAP Reading – Informational Text: Read nonfiction together – news articles, science magazines for kids, biographies. After reading ask your child to summarize the main idea and identify two pieces of evidence that support it. ReadWorks has free informational passages organized by Lexile level that make this easy to practice at home.
MAP Language Usage (grammar and writing conventions): This is the most overlooked subject on the MAP report. Language Usage covers grammar, usage, punctuation, and writing conventions. The most practical home activity is simply reading quality writing together and discussing why certain sentences work – not grammar drills, which rarely transfer to actual writing ability.
MAP Science (where tested): Discuss what your child is learning in science at school. Watch science documentaries together and talk about them. Science MAP scores respond more to curiosity and exposure than to drilled practice.
Step 5: Understanding Growth – The Number Most Parents Miss
This section does not exist in most parent guides to MAP and it is the most important thing I can tell you about how to read these results correctly.
MAP Growth measures two completely separate things simultaneously. Achievement is where your child is right now on the RIT scale relative to peers. Growth is how much they moved from the last test to this one relative to what was expected. These two things can point in completely different directions and both matter.
Consider two students both in 4th grade Math with a Fall RIT score of 195, which is below the 50th percentile for 4th grade. By Winter, Student A has a RIT of 201 – a gain of 6 points. Student B has a RIT of 198 – a gain of 3 points. If NWEA projected 5 points of growth for both students, then Student A exceeded projections and is closing the gap between themselves and peers. Student B fell short of projections and the gap may be widening. The Winter percentiles alone will not tell you this clearly. The growth comparison will.
Kindergarten: 10-12 RIT points | Grade 1: 8-10 points | Grade 2: 6-8 points | Grade 3: 4-7 points
Grade 4: 3-6 points | Grade 5: 3-5 points | Grade 6-8: 2-4 points
Younger students grow faster in RIT terms. Growth naturally slows as students get older. This is expected and normal.
A child below the 50th percentile who is consistently meeting or exceeding Projected Growth will close the gap over time. A child above the 50th percentile who is consistently falling short of Projected Growth will eventually see their percentile decline. The goal is both: adequate achievement level AND adequate growth rate. For a detailed guide to what constitutes a good score by grade see our What Is a Good MAP Score guide.
Step 6: What to Expect and How to Know It Is Working
Most schools test in Fall, Winter, and Spring. The Winter MAP test is your first real checkpoint after a concerning Fall result – giving you roughly 10 to 14 weeks of targeted work before the next data point.
What you are watching for at Winter is not necessarily a jump in percentile – that is a high bar in one testing window. What you are watching for is Observed Growth that meets or exceeds Projected Growth. That tells you the targeted support and home practice are working even if the overall achievement level has not yet shifted dramatically.
You will also see signs of progress before the Winter test if practice is working. Your child will make fewer errors on specific homework tasks in the goal areas you targeted. They will be more willing to read independently. They will begin volunteering answers in the skill areas where they were previously avoiding participation. These are real signals before any score changes.
If Winter arrives and Observed Growth is again significantly below Projected Growth despite consistent targeted support and school intervention, that is when to have a more serious conversation with the teacher about formal evaluation. Two or three windows of below-projected growth despite genuine effort is a pattern that warrants investigation. One flat result is not.
MAP Growth score resources on Readyscores.com
Use these to look up exactly what your child’s RIT score means as a percentile for their grade and testing season, and to understand what a good score looks like at each grade level.
📑 NWEA MAP Test Scores – Complete RIT Charts by Grade (2025-2026)
📑 What Is a Good MAP Score for My Child’s Grade?
📑 NWEA MAP FAQ – All Common Parent Questions Answered
You Are Already Doing the Right Thing
The most important thing I want you to take from this article is that a below-average MAP score is a starting point, not a verdict. It tells you and the teacher precisely where to focus attention. Used correctly, that information is genuinely useful. It is far better than not knowing.
Contact the teacher this week. Look at the goal area breakdown today – not just the overall percentile. Find your child’s Lexile range on the Reading report and use it to pick a book tonight. Start with 15 minutes of targeted practice tomorrow in the specific skill area that needs it most.
The Spring MAP test will tell you if it is working. Based on 18 years of watching families do exactly this, I genuinely believe it will.
About the Author
Stephanie Smith is the Lead Writer and Editorial Head of the Readyscores.com Editorial Team. She is a former district-level assessment coordinator with 18 years in public education and a recognized expert in iReady Diagnostic scores and NWEA MAP Test scores interpretation. She has trained educators across multiple states in score interpretation, growth analysis, and instructional response to student data.
Disclaimer: This guide is an independent educational resource maintained by Readyscores.com. Readyscores.com is not affiliated with or endorsed by NWEA (Northwest Evaluation Association). MAP Growth and MAP are registered trademarks of NWEA. All score ranges and growth norms referenced are based on NWEA’s 2025 MAP Growth Norms Technical Manual published August 2025. For official guidance about your child’s specific results, contact your school or district directly.