
NWEA MAP Test Scores 2025-2026 [Map Score Charts By Grade Level]
NWEA MAP Test Scores by Grade Level 2026 – Complete Percentile Charts, RIT Score Guide & Parent FAQ
By Stephanie Smith · Updated August 2026 · Data: NWEA 2025 MAP Growth Norms (applied 2025–2026).
This page contains the complete NWEA MAP Growth RIT score percentile charts for 2025-2026, covering Math and Reading for Grades K–12 across all three testing seasons — Fall, Winter, and Spring. All tables show student-level norms only — the correct reference for parents interpreting their individual child’s score. School-level comparison tables have been removed from this page as they are intended for administrators, not families.
Quick Lookup: NWEA MAP Score Charts by Grade Level (2026-2027)
NWEA Map Math Scores (Quick Lookup)
NWEA Map Reading Scores (Quick Lookup)
NWEA Map Science Scores (Quick Lookup)
NWEA Map Language Scores (Quick Lookup)
Explore more NWEA MAP score charts and tools:
NWEA Map Scores Overview
NWEA Map Math Scores Chart
NWEA Map Science Scores Chart
NWEA Map Reading Scores Chart
NWEA Map Language Scores Chart
What Is a Good Map Score?
NWEA Map Growth Tracker
NWEA Map Score Calculator
Below Grade Level? What to Do
📋 On this page:
- What Is a RIT Score?
- MAP Math Scores — Fall 2025-2026
- MAP Math Scores — Winter 2025-2026
- MAP Math Scores — Spring 2025-2026
- MAP Reading Scores — Fall 2025-2026
- MAP Reading Scores — Winter 2025-2026
- MAP Reading Scores — Spring 2025-2026
- How to Read Your Child’s MAP Report
- How Scores Change Across Fall, Winter & Spring
- What Is a Good NWEA MAP Score by Grade?
- 30 Frequently Asked Questions
What Is a RIT Score? NWEA MAP Growth Explained
RIT stands for Rasch unIT — a continuous equal-interval measurement scale developed by NWEA to track academic achievement from Kindergarten through Grade 12 on a single consistent ruler. Unlike a percentage correct or a letter grade, a RIT score has the same meaning regardless of grade level. A Math RIT score of 220 represents the same depth of mathematical knowledge whether earned by a 4th grader or a 7th grader — which is what makes the scale so powerful for tracking long-term growth.
The scale runs roughly from 100 to 300, with most K–12 students falling between 130 and 260. Because it is equal-interval, every single point represents the same amount of learning: a gain from 180 to 190 is identical in meaning to a gain from 220 to 230. This is why educators use RIT scores to measure annual academic growth rather than simply pass/fail grade-level benchmarks.
MAP Growth is also computer-adaptive: each question adjusts in difficulty based on how the student answered the previous one. The test quickly homes in on a student’s true level, usually within 40–55 questions. Students should expect the questions to get progressively harder as they answer correctly — that is the test working as designed, not a sign of struggling. Reassure your child: the hardest questions only appear when they are doing well.
NWEA MAP Math Scores 2025-2026 — Fall Score Chart with Percentiles (Grades K–12)
Test window: Start of school year through approximately November
To use this chart: find your child’s grade column, locate their RIT score in the nearest row, and read the percentile on the left. The highlighted row at the 50th percentile shows the national average for each grade in Fall. Fall scores are always the lowest of the three seasons — this is completely normal and expected.
| Percentile | K | Gr 1 | Gr 2 | Gr 3 | Gr 4 | Gr 5 | Gr 6 | Gr 7 | Gr 8 | Gr 9 | Gr 10 | Gr 11 | Gr 12 |
| 5 | 121 | 137 | 147 | 158 | 171 | 180 | 184 | 189 | 192 | 196 | 196 | 195 | 194 |
| 10 | 125 | 142 | 153 | 164 | 177 | 185 | 190 | 195 | 199 | 202 | 203 | 203 | 201 |
| 15 | 128 | 145 | 157 | 168 | 181 | 189 | 194 | 199 | 203 | 207 | 208 | 208 | 206 |
| 20 | 131 | 148 | 160 | 171 | 184 | 193 | 197 | 203 | 207 | 210 | 211 | 212 | 211 |
| 25 | 133 | 150 | 162 | 174 | 186 | 195 | 199 | 206 | 210 | 213 | 214 | 215 | 214 |
| 30 | 135 | 152 | 165 | 176 | 189 | 198 | 202 | 208 | 212 | 216 | 217 | 218 | 217 |
| 35 | 136 | 154 | 167 | 178 | 191 | 200 | 204 | 211 | 215 | 218 | 220 | 221 | 220 |
| 40 | 138 | 156 | 169 | 180 | 193 | 202 | 206 | 213 | 217 | 220 | 222 | 224 | 223 |
| 45 | 140 | 158 | 171 | 182 | 195 | 204 | 208 | 215 | 220 | 223 | 224 | 227 | 226 |
| 50 | 141 | 159 | 173 | 184 | 197 | 206 | 210 | 217 | 222 | 225 | 227 | 229 | 228 |
| 55 | 143 | 161 | 175 | 186 | 199 | 208 | 212 | 219 | 224 | 227 | 229 | 232 | 231 |
| 60 | 144 | 163 | 177 | 188 | 201 | 210 | 214 | 222 | 227 | 229 | 232 | 234 | 233 |
| 65 | 146 | 164 | 179 | 190 | 203 | 212 | 216 | 224 | 229 | 232 | 234 | 237 | 236 |
| 70 | 148 | 166 | 181 | 192 | 205 | 215 | 219 | 226 | 232 | 234 | 237 | 240 | 239 |
| 75 | 149 | 168 | 183 | 195 | 208 | 217 | 221 | 229 | 234 | 237 | 239 | 243 | 242 |
| 80 | 152 | 171 | 186 | 197 | 210 | 220 | 224 | 232 | 237 | 240 | 242 | 246 | 246 |
| 85 | 154 | 173 | 189 | 200 | 214 | 223 | 227 | 235 | 241 | 243 | 246 | 250 | 250 |
| 90 | 157 | 176 | 193 | 204 | 217 | 227 | 231 | 239 | 246 | 248 | 251 | 255 | 255 |
| 95 | 161 | 181 | 198 | 210 | 223 | 233 | 237 | 246 | 252 | 254 | 257 | 263 | 263 |
Table B.1 · NWEA MAP Math Scores 2025-2026 — Fall, Student Achievement Percentiles, Grades K–12. Blue highlighted row = 50th percentile (national median). Source: NWEA MAP Growth Norms, applied 2025–2026.
Percentiles 1–99 · Grades K–12 · 50th percentile row highlighted · Source: NWEA 2025 MAP Growth Norms
NWEA MAP Math Scores 2025-2026 — Winter Score Chart with Percentiles (Grades K–12)
Test window: Approximately November through March · Norms are higher than Fall — do not compare Fall and Winter percentiles directly
Winter norms are calibrated to mid-year expected performance. Expect your child’s RIT score to be notably higher than their Fall result if they are growing on track — this is completely normal. The 50th percentile (highlighted) shows what is nationally average for each grade at mid-year. If the scale score is higher than Fall but the percentile is slightly lower, it means your child grew but peers grew a little faster — worth a conversation with the teacher but not a cause for alarm.
| Percentile | K | Gr 1 | Gr 2 | Gr 3 | Gr 4 | Gr 5 | Gr 6 | Gr 7 | Gr 8 | Gr 9 | Gr 10 | Gr 11 | Gr 12 |
| 5 | 130 | 146 | 155 | 166 | 176 | 183 | 187 | 191 | 194 | 196 | 196 | 195 | 194 |
| 10 | 135 | 151 | 161 | 172 | 183 | 189 | 194 | 197 | 201 | 203 | 204 | 203 | 202 |
| 15 | 138 | 154 | 165 | 176 | 187 | 194 | 198 | 202 | 206 | 207 | 208 | 209 | 207 |
| 20 | 140 | 157 | 168 | 179 | 190 | 197 | 201 | 206 | 210 | 211 | 212 | 213 | 211 |
| 25 | 142 | 159 | 171 | 182 | 193 | 200 | 204 | 209 | 213 | 214 | 216 | 217 | 215 |
| 30 | 144 | 161 | 173 | 184 | 196 | 203 | 207 | 211 | 216 | 217 | 219 | 220 | 218 |
| 35 | 146 | 163 | 175 | 186 | 198 | 205 | 209 | 214 | 219 | 220 | 222 | 223 | 221 |
| 40 | 147 | 165 | 177 | 189 | 200 | 207 | 212 | 216 | 221 | 222 | 224 | 226 | 224 |
| 45 | 149 | 167 | 179 | 191 | 202 | 210 | 214 | 219 | 224 | 225 | 227 | 229 | 227 |
| 50 | 151 | 168 | 181 | 193 | 204 | 212 | 216 | 221 | 226 | 227 | 229 | 231 | 230 |
| 55 | 152 | 170 | 183 | 195 | 207 | 214 | 218 | 223 | 228 | 230 | 232 | 234 | 233 |
| 60 | 154 | 172 | 185 | 197 | 209 | 216 | 220 | 226 | 231 | 232 | 235 | 237 | 235 |
| 65 | 155 | 174 | 187 | 199 | 211 | 219 | 223 | 228 | 233 | 235 | 237 | 240 | 238 |
| 70 | 157 | 176 | 189 | 201 | 213 | 221 | 225 | 231 | 236 | 237 | 240 | 243 | 241 |
| 75 | 159 | 178 | 192 | 204 | 216 | 224 | 228 | 233 | 239 | 240 | 243 | 246 | 245 |
| 80 | 161 | 180 | 194 | 206 | 219 | 226 | 231 | 236 | 242 | 243 | 246 | 250 | 248 |
| 85 | 164 | 183 | 197 | 210 | 222 | 230 | 234 | 240 | 246 | 247 | 250 | 254 | 252 |
| 90 | 167 | 186 | 201 | 214 | 226 | 234 | 238 | 245 | 251 | 252 | 255 | 259 | 258 |
| 95 | 171 | 191 | 207 | 220 | 232 | 240 | 245 | 251 | 258 | 259 | 263 | 267 | 266 |
Table B.3 · NWEA MAP Math Scores 2025-2026 — Winter, Student Achievement Percentiles, Grades K–12. Blue highlighted row = 50th percentile (national median). Source: NWEA MAP Growth Norms, applied 2025–2026.
Percentiles 1–99 · Grades K–12 · 50th percentile row highlighted · Source: NWEA 2025 MAP Growth Norms
NWEA MAP Math Scores 2025-2026 — Spring Score Chart with Percentiles (Grades K–12)
Test window: Approximately March through June · Spring norms are the highest of the year and reflect expected end-of-grade performance
Spring norms represent expected end-of-year performance. Students on track should score substantially higher than their Fall baseline. Compare your child’s Spring RIT to their Fall RIT — the difference is their total annual growth, and is the single most meaningful number on the entire report. The highlighted 50th percentile row shows the national year-end average for each grade.
| Percentile | K | Gr 1 | Gr 2 | Gr 3 | Gr 4 | Gr 5 | Gr 6 | Gr 7 | Gr 8 | Gr 9 | Gr 10 | Gr 11 | Gr 12 |
| 5 | 136 | 151 | 161 | 171 | 180 | 186 | 190 | 192 | 196 | 194 | 195 | 195 | 193 |
| 10 | 141 | 157 | 167 | 177 | 187 | 192 | 197 | 199 | 203 | 202 | 203 | 203 | 201 |
| 15 | 144 | 160 | 171 | 181 | 191 | 197 | 201 | 204 | 208 | 207 | 208 | 209 | 207 |
| 20 | 147 | 163 | 174 | 185 | 195 | 200 | 205 | 208 | 212 | 211 | 213 | 214 | 212 |
| 25 | 149 | 165 | 177 | 188 | 198 | 204 | 208 | 211 | 215 | 215 | 216 | 217 | 215 |
| 30 | 151 | 167 | 179 | 190 | 201 | 206 | 211 | 214 | 218 | 218 | 220 | 221 | 219 |
| 35 | 153 | 169 | 181 | 193 | 203 | 209 | 213 | 216 | 221 | 221 | 223 | 224 | 222 |
| 40 | 154 | 171 | 183 | 195 | 206 | 211 | 216 | 219 | 224 | 223 | 226 | 227 | 225 |
| 45 | 156 | 173 | 185 | 197 | 208 | 214 | 218 | 221 | 226 | 226 | 229 | 230 | 228 |
| 50 | 158 | 175 | 187 | 199 | 210 | 216 | 220 | 224 | 229 | 229 | 231 | 233 | 231 |
| 55 | 159 | 177 | 189 | 201 | 212 | 218 | 223 | 226 | 231 | 231 | 234 | 236 | 234 |
| 60 | 161 | 179 | 192 | 203 | 215 | 221 | 225 | 229 | 234 | 234 | 237 | 239 | 237 |
| 65 | 163 | 181 | 194 | 206 | 217 | 223 | 227 | 231 | 237 | 237 | 240 | 242 | 240 |
| 70 | 165 | 183 | 196 | 208 | 220 | 226 | 230 | 234 | 239 | 240 | 243 | 245 | 243 |
| 75 | 167 | 185 | 198 | 211 | 222 | 228 | 233 | 237 | 242 | 243 | 246 | 249 | 247 |
| 80 | 169 | 187 | 201 | 213 | 225 | 232 | 236 | 240 | 246 | 247 | 250 | 252 | 251 |
| 85 | 171 | 190 | 204 | 217 | 229 | 235 | 239 | 244 | 250 | 251 | 254 | 257 | 255 |
| 90 | 174 | 193 | 208 | 221 | 233 | 240 | 244 | 249 | 255 | 256 | 260 | 263 | 261 |
| 95 | 179 | 199 | 214 | 227 | 240 | 246 | 251 | 256 | 262 | 263 | 268 | 271 | 269 |
Table B.5 · NWEA MAP Math Scores 2025-2026 — Spring, Student Achievement Percentiles, Grades K–12. Blue highlighted row = 50th percentile (national median). Source: NWEA MAP Growth Norms, applied 2025–2026.
Percentiles 1–99 · Grades K–12 · 50th percentile row highlighted · Source: NWEA 2025 MAP Growth Norms
NWEA MAP Reading Scores 2025-2026 — Fall Score Chart with Percentiles (Grades K–12)
Test window: Start of school year through approximately November
Reading RIT scores follow the same pattern as Math — Fall is lowest, Spring is highest. The Reading report also generates a Lexile range, which you can use immediately to select books matched to your child’s current reading level. The 50th percentile row (highlighted) is the national average for each grade at the start of the year. Reading growth tends to be more gradual than Math — small gains between seasons are meaningful and expected.
| Percentile | K | Gr 1 | Gr 2 | Gr 3 | Gr 4 | Gr 5 | Gr 6 | Gr 7 | Gr 8 | Gr 9 | Gr 10 | Gr 11 | Gr 12 |
| 5 | 123 | 134 | 142 | 155 | 166 | 175 | 181 | 185 | 188 | 186 | 188 | 188 | 187 |
| 10 | 126 | 139 | 148 | 161 | 173 | 181 | 187 | 191 | 194 | 193 | 195 | 195 | 193 |
| 15 | 128 | 142 | 152 | 166 | 177 | 186 | 191 | 195 | 198 | 197 | 199 | 199 | 198 |
| 20 | 130 | 145 | 156 | 169 | 181 | 189 | 195 | 198 | 201 | 201 | 203 | 203 | 202 |
| 25 | 132 | 147 | 159 | 172 | 184 | 192 | 198 | 201 | 204 | 204 | 206 | 206 | 205 |
| 30 | 133 | 149 | 161 | 175 | 186 | 195 | 200 | 204 | 207 | 207 | 208 | 209 | 208 |
| 35 | 134 | 150 | 163 | 178 | 189 | 197 | 202 | 206 | 209 | 209 | 211 | 211 | 210 |
| 40 | 136 | 152 | 166 | 180 | 191 | 199 | 205 | 208 | 211 | 212 | 213 | 214 | 213 |
| 45 | 137 | 154 | 168 | 182 | 194 | 201 | 207 | 210 | 214 | 214 | 215 | 216 | 215 |
| 50 | 138 | 155 | 170 | 185 | 196 | 204 | 209 | 212 | 216 | 216 | 218 | 218 | 218 |
| 55 | 139 | 157 | 172 | 187 | 198 | 206 | 211 | 214 | 218 | 218 | 220 | 220 | 220 |
| 60 | 140 | 159 | 174 | 189 | 200 | 208 | 213 | 217 | 220 | 221 | 222 | 223 | 222 |
| 65 | 142 | 160 | 177 | 192 | 203 | 210 | 215 | 219 | 222 | 223 | 225 | 225 | 225 |
| 70 | 143 | 162 | 179 | 194 | 205 | 213 | 218 | 221 | 225 | 226 | 227 | 228 | 228 |
| 75 | 144 | 164 | 182 | 197 | 208 | 215 | 220 | 224 | 227 | 228 | 230 | 230 | 230 |
| 80 | 146 | 166 | 184 | 200 | 211 | 218 | 223 | 226 | 230 | 231 | 233 | 233 | 234 |
| 85 | 148 | 169 | 188 | 204 | 215 | 222 | 226 | 230 | 233 | 235 | 236 | 237 | 237 |
| 90 | 150 | 172 | 192 | 208 | 219 | 226 | 231 | 234 | 238 | 239 | 241 | 241 | 242 |
| 95 | 153 | 177 | 198 | 215 | 226 | 232 | 237 | 240 | 244 | 246 | 247 | 248 | 249 |
Table B.7 · NWEA MAP Reading Scores 2025-2026 — Fall, Student Achievement Percentiles, Grades K–12. Green highlighted row = 50th percentile (national median). Source: NWEA MAP Growth Norms, applied 2025–2026.
Percentiles 1–99 · Grades K–12 · 50th percentile row highlighted · Source: NWEA 2025 MAP Growth Norms
NWEA MAP Reading Scores 2025-2026 — Winter Score Chart with Percentiles (Grades K–12)
Test window: Approximately November through March · Norms are higher than Fall — do not compare Fall and Winter Reading percentiles directly
Winter Reading norms are calibrated to mid-year expected performance. A higher RIT than Fall is a healthy sign of progress. The 50th percentile (highlighted) shows what is nationally average for each grade at mid-year. The Winter Lexile range from the report is useful for selecting books and reading material for the second half of the school year.
| Percentile | K | Gr 1 | Gr 2 | Gr 3 | Gr 4 | Gr 5 | Gr 6 | Gr 7 | Gr 8 | Gr 9 | Gr 10 | Gr 11 | Gr 12 |
| 5 | 128 | 139 | 149 | 160 | 170 | 178 | 183 | 186 | 189 | 187 | 188 | 188 | 186 |
| 10 | 132 | 145 | 155 | 167 | 177 | 184 | 189 | 192 | 195 | 194 | 195 | 194 | 192 |
| 15 | 135 | 148 | 159 | 171 | 181 | 189 | 193 | 196 | 199 | 198 | 199 | 199 | 197 |
| 20 | 137 | 151 | 162 | 175 | 184 | 192 | 197 | 200 | 203 | 201 | 203 | 203 | 201 |
| 25 | 139 | 153 | 165 | 178 | 187 | 195 | 199 | 202 | 205 | 205 | 206 | 206 | 204 |
| 30 | 140 | 155 | 168 | 180 | 190 | 197 | 202 | 205 | 208 | 207 | 209 | 208 | 207 |
| 35 | 142 | 157 | 170 | 183 | 193 | 200 | 204 | 207 | 210 | 210 | 211 | 211 | 210 |
| 40 | 143 | 159 | 172 | 185 | 195 | 202 | 206 | 210 | 213 | 212 | 214 | 213 | 212 |
| 45 | 145 | 161 | 175 | 188 | 197 | 204 | 209 | 212 | 215 | 214 | 216 | 216 | 214 |
| 50 | 146 | 163 | 177 | 190 | 199 | 206 | 211 | 214 | 217 | 217 | 218 | 218 | 217 |
| 55 | 147 | 164 | 179 | 192 | 202 | 209 | 213 | 216 | 219 | 219 | 220 | 220 | 219 |
| 60 | 149 | 166 | 181 | 194 | 204 | 211 | 215 | 218 | 221 | 221 | 223 | 223 | 222 |
| 65 | 150 | 168 | 183 | 197 | 206 | 213 | 217 | 220 | 223 | 224 | 225 | 225 | 224 |
| 70 | 152 | 170 | 186 | 199 | 209 | 215 | 219 | 223 | 226 | 226 | 228 | 228 | 227 |
| 75 | 153 | 172 | 188 | 202 | 211 | 218 | 222 | 225 | 228 | 229 | 230 | 230 | 230 |
| 80 | 155 | 174 | 191 | 205 | 214 | 221 | 225 | 228 | 231 | 232 | 233 | 233 | 233 |
| 85 | 157 | 177 | 194 | 209 | 218 | 224 | 228 | 231 | 235 | 236 | 237 | 237 | 237 |
| 90 | 160 | 181 | 199 | 213 | 222 | 228 | 232 | 235 | 239 | 240 | 241 | 242 | 241 |
| 95 | 164 | 186 | 205 | 220 | 229 | 235 | 238 | 241 | 245 | 247 | 248 | 248 | 248 |
Table B.9 · NWEA MAP Reading Scores 2025-2026 — Winter, Student Achievement Percentiles, Grades K–12. Green highlighted row = 50th percentile (national median). Source: NWEA MAP Growth Norms, applied 2025–2026.
Percentiles 1–99 · Grades K–12 · 50th percentile row highlighted · Source: NWEA 2025 MAP Growth Norms
NWEA MAP Reading Scores 2025-2026 — Spring Score Chart with Percentiles (Grades K–12)
Test window: Approximately March through June · Spring norms are the highest of the year and reflect expected end-of-grade reading performance
Spring Reading norms measure where a student performs nationally at the very end of the school year. Students on track should score substantially higher than their Fall baseline. The Spring Lexile range is particularly useful for selecting summer reading books at the right challenge level. Compare Spring RIT to Fall RIT to calculate full annual reading growth.
| Percentile | K | Gr 1 | Gr 2 | Gr 3 | Gr 4 | Gr 5 | Gr 6 | Gr 7 | Gr 8 | Gr 9 | Gr 10 | Gr 11 | Gr 12 |
| 5 | 131 | 142 | 153 | 164 | 173 | 180 | 185 | 187 | 190 | 187 | 188 | 187 | 184 |
| 10 | 136 | 148 | 159 | 171 | 179 | 186 | 191 | 193 | 196 | 194 | 195 | 194 | 191 |
| 15 | 139 | 152 | 164 | 175 | 184 | 191 | 195 | 197 | 200 | 198 | 200 | 198 | 196 |
| 20 | 141 | 155 | 167 | 179 | 187 | 194 | 198 | 201 | 203 | 202 | 203 | 202 | 200 |
| 25 | 143 | 157 | 170 | 182 | 190 | 197 | 201 | 203 | 206 | 205 | 206 | 205 | 203 |
| 30 | 145 | 160 | 173 | 184 | 193 | 199 | 203 | 206 | 209 | 208 | 209 | 208 | 206 |
| 35 | 147 | 162 | 175 | 187 | 195 | 202 | 206 | 208 | 211 | 210 | 211 | 211 | 209 |
| 40 | 149 | 164 | 177 | 189 | 198 | 204 | 208 | 211 | 213 | 213 | 214 | 213 | 211 |
| 45 | 150 | 166 | 180 | 192 | 200 | 206 | 210 | 213 | 216 | 215 | 216 | 215 | 214 |
| 50 | 152 | 168 | 182 | 194 | 202 | 208 | 212 | 215 | 218 | 217 | 218 | 218 | 216 |
| 55 | 154 | 170 | 184 | 196 | 204 | 211 | 214 | 217 | 220 | 219 | 221 | 220 | 219 |
| 60 | 155 | 172 | 186 | 198 | 207 | 213 | 216 | 219 | 222 | 222 | 223 | 223 | 221 |
| 65 | 157 | 174 | 188 | 201 | 209 | 215 | 218 | 221 | 224 | 224 | 225 | 225 | 224 |
| 70 | 159 | 176 | 191 | 203 | 211 | 217 | 221 | 224 | 227 | 227 | 228 | 228 | 226 |
| 75 | 161 | 178 | 193 | 206 | 214 | 220 | 223 | 226 | 229 | 230 | 231 | 230 | 229 |
| 80 | 163 | 181 | 196 | 209 | 217 | 223 | 226 | 229 | 232 | 233 | 234 | 234 | 233 |
| 85 | 165 | 184 | 200 | 213 | 220 | 226 | 229 | 232 | 236 | 236 | 237 | 237 | 236 |
| 90 | 168 | 188 | 204 | 217 | 225 | 230 | 233 | 237 | 240 | 241 | 242 | 242 | 241 |
| 95 | 173 | 193 | 210 | 224 | 231 | 237 | 239 | 243 | 246 | 247 | 248 | 249 | 248 |
Table B.11 · NWEA MAP Reading Scores 2025-2026 — Spring, Student Achievement Percentiles, Grades K–12. Green highlighted row = 50th percentile (national median). Source: NWEA MAP Growth Norms, applied 2025–2026.
Percentiles 1–99 · Grades K–12 · 50th percentile row highlighted · Source: NWEA 2025 MAP Growth Norms
📚 How to Read Your Child’s NWEA MAP Score Chart
When your child’s school sends home their MAP Growth results, you will see a number called a RIT score. This is not a percentage — it is a position on a scale that runs from roughly 100 to 300, measuring how much your child knows right now in Math or Reading. Here is exactly how to use the charts above to understand that number in three simple steps.
① Find your child’s grade column
Look across the top row of the chart for your child’s current grade — for example, Gr 4 for a 4th grader. That entire column contains all the score information for that grade. Every number in that column is a RIT score for Grade 4 students.
② Find your child’s RIT score in that column
Scan down the grade column until you find the number closest to your child’s RIT score. For example, if your child’s report says their Math RIT score is 203 and they are in Grade 4, find the row in the Grade 4 column where the number is closest to 203.
③ Read the percentile on the left
Once you have found the row that matches your child’s RIT score, look all the way to the left of that row. The number there is the national percentile rank. This tells you how your child compares to students across the country in the same grade who took the test at the same time of year. A percentile of 60 means your child scored higher than 60% of students nationally.
What does the percentile number actually mean?
| Percentile | What it means | Plain language |
| 90th – 99th | Exceptional | Your child scored higher than 90–99% of students nationally. Well above grade level. |
| 75th – 89th | Above average | Your child is performing strongly above the national average for their grade. |
| 50th | National average | Exactly at the national average. Half of students scored above this, half below. |
| 25th – 49th | Below average | Your child scored below the national midpoint. Not cause for alarm, but worth discussing with the teacher. |
| 1st – 24th | Needs support | Your child may benefit from additional instructional support in this subject area. |
Three important things every parent should know
📄 Worked example: How to read a real score
Let’s say your child is in Grade 5 and their school tested them in the Fall. Their MAP report shows a Math RIT score of 212.
Step 1: Go to the NWEA MAP Math Fall chart above and find the Gr 5 column.
Step 2: Scan down the Gr 5 column. You can see that the 65th percentile row shows exactly 212. Your child’s score matches this row precisely.
Step 3: This means your child scored higher than 65% of 5th grade students nationally who were tested at the same time of year. They are performing above the national average for their grade in the Fall.
What to do next: Ask the teacher which Math domain sub-score was lowest on the report — that is the area where targeted practice at home will have the biggest impact. And check back after the Winter test to see if the RIT score has grown.
How to Read Your Child’s NWEA MAP Score Report
MAP Growth results typically come home via the school’s parent portal (PowerSchool, Infinite Campus, ParentVUE, etc.) or a printed Family Report. Every number on that report has a specific meaning. Here is what each element tells you:
📄 What’s on the NWEA MAP Family Report:
- RIT Score: The primary number. Look it up in the tables on this page using the correct grade and testing season to find the national percentile.
- Percentile Rank (1–99): Compares your child to a national sample of same-grade peers who tested in the same season. 50th percentile = exactly at the national average.
- Lexile Range (Reading only): A reading difficulty range your child can access comfortably. Use this to select books at the right level — practical and immediately useful.
- Goal Area Scores: Sub-scores by content domain showing specific strengths and gaps (e.g., Operations & Algebraic Thinking, Literary Text, Geometry).
- Typical Growth target: The RIT gain NWEA expects for a student at that grade and starting level. Different starting levels have different expected growth targets.
- Historical data: If available, Fall, Winter, and Spring scores across years — the clearest long-term view of a student’s academic trajectory.
The RIT score is not a percentage. A Grade 5 student with a Math RIT of 210 did not answer 21% of questions correctly. RIT is a position on a developmental continuum. Always convert it using the tables above, selecting the correct grade and season, to find the national percentile rank.
How NWEA MAP Scores Change Across Fall, Winter & Spring
The three testing season norms are completely separate scales. A RIT score at the 60th percentile in Fall will appear at a lower percentile on the Spring chart — because Spring norms are higher. This is not a problem; it is intentional design. Students are expected to grow, and the national comparison group grows alongside them. A student maintaining the same percentile across all three seasons has grown in absolute terms while keeping pace with peers nationally.
| Season | Typical Window | Purpose | What to Expect |
|---|---|---|---|
| Fall | Aug–Nov | Beginning-of-year baseline | Lowest RIT of the year — completely normal |
| Winter | Nov–Mar | Mid-year progress check | RIT should be higher than Fall |
| Spring | Mar–Jun | End-of-year achievement | Highest RIT — compare to Fall to measure full annual growth |
What Is a Good NWEA MAP Score by Grade?
A “good” MAP score is one at or above the 50th percentile for your child’s grade and testing season — meaning the student performed at or better than the national average. Scores at the 75th percentile or above are considered strong. Scores at the 25th percentile or below typically indicate a need for additional instructional support. However, the most meaningful benchmark is not a single snapshot but the growth from Fall to Spring — a student improving from the 30th to the 42nd percentile is making genuine, significant academic progress.
The quick-reference table below shows the 25th, 50th, 75th, and 90th percentile RIT benchmarks for Fall testing in both Math and Reading for Grades K–12. For Winter and Spring benchmarks, use the full score charts above.
| Grade | Math — Fall RIT Score | Reading — Fall RIT Score | ||||||
|---|---|---|---|---|---|---|---|---|
| 25th %ile | 50th %ile | 75th %ile | 90th %ile | 25th %ile | 50th %ile | 75th %ile | 90th %ile | |
| K | 133 | 141 | 149 | 157 | 150 | 159 | 169 | 179 |
| 1 | 150 | 159 | 168 | 176 | 161 | 171 | 181 | 192 |
| 2 | 162 | 173 | 183 | 193 | 170 | 180 | 191 | 202 |
| 3 | 174 | 184 | 195 | 204 | 175 | 185 | 196 | 207 |
| 4 | 186 | 197 | 208 | 217 | 180 | 190 | 202 | 213 |
| 5 | 195 | 206 | 217 | 227 | 184 | 195 | 207 | 219 |
| 6 | 199 | 210 | 221 | 231 | 186 | 197 | 210 | 222 |
| 7 | 206 | 217 | 229 | 239 | 187 | 199 | 212 | 225 |
| 8 | 210 | 222 | 234 | 246 | 188 | 201 | 215 | 229 |
| 9 | 213 | 225 | 237 | 248 | 190 | 203 | 218 | 231 |
| 10 | 214 | 227 | 239 | 251 | 190 | 203 | 218 | 232 |
| 11 | 215 | 229 | 243 | 255 | 190 | 203 | 218 | 231 |
| 12 | 214 | 228 | 242 | 255 | 189 | 202 | 217 | 230 |
Fall norms only. Shaded column = 50th percentile (national median). Source: NWEA 2025 MAP Growth Norms. For Winter and Spring benchmarks, consult the full score charts above.
30 Frequently Asked Questions About NWEA MAP Test Scores
Answers to the most common questions from parents about NWEA MAP Growth scores, RIT scores, percentiles, and how to use score reports.
Please see the complete NWEA FAQ page with Map Scores and Definitions, here.
Learn what is considered a Good Map Score (by Grade level) here.
What is a RIT score on the MAP test?
A RIT score (Rasch unIT) is a number on a continuous equal-interval scale that measures academic achievement regardless of grade level — a score of 220 in Math means the same thing in 4th grade as it does in 7th grade. Unlike a percentage correct, the RIT scale is designed specifically for tracking long-term growth; a gain from 185 to 195 represents the same amount of learning as a gain from 215 to 225.
What is a good MAP test score?
A good MAP score is at or above the 50th national percentile for your child’s grade and testing season, meaning they are performing at or above the national average for their grade. Scores at the 75th percentile or above indicate strong academic performance, while scores below the 25th percentile often signal that additional instructional support would be helpful.
What is a good MAP score for 3rd grade?
For 3rd grade in Fall, a good MAP score is at or above the 50th percentile: approximately RIT 184 in Math and RIT 185 in Reading. Scores at or above RIT 195 in Math and RIT 196 in Reading represent strong above-average performance (75th percentile). Third grade is a foundational year, particularly for Math — students who score below the 25th percentile may need targeted support with multiplication, fractions, and place value.
What is a good MAP score for 4th grade?
For 4th grade in Fall, the 50th percentile benchmark is approximately RIT 197 in Math and RIT 190 in Reading. Scores of RIT 208 or above in Math and RIT 202 in Reading indicate above-average performance at the 75th percentile. Fourth grade is when multi-digit multiplication and fraction operations become central — gaps here often compound in 5th grade and beyond.
What is a good MAP score for 5th grade?
For 5th grade in Fall, the 50th percentile is approximately RIT 206 in Math and RIT 195 in Reading. A score above RIT 217 in Math (75th percentile) is considered strong. Fifth grade is a critical gateway year — students who enter 6th grade with significant Math gaps, particularly in fraction operations and decimals, face increasing difficulty in middle school mathematics.
What is a good MAP score for 6th grade?
For 6th grade in Fall, a good score is at or above the 50th percentile: approximately RIT 210 in Math and RIT 197 in Reading. The 75th percentile for 6th grade Math falls at approximately RIT 221. Sixth grade marks the transition to middle school math with ratios, negative numbers, and introductory algebra — students scoring below the 25th percentile may benefit from focused pre-algebra support.
What is a good MAP score for 7th grade?
For 7th grade in Fall, the 50th percentile is approximately RIT 217 in Math and RIT 199 in Reading. Scores at or above RIT 229 in Math (75th percentile) reflect strong performance. Students scoring in this range are typically on track for high school algebra. The 7th grade curriculum is heavily focused on proportional reasoning and rational numbers — both essential algebra prerequisites.
What is a good MAP score for 8th grade?
For 8th grade in Fall, the 50th percentile is approximately RIT 222 in Math and RIT 201 in Reading. A Math score at or above RIT 234 (75th percentile) indicates strong performance and readiness for Algebra 1 or beyond. Students scoring well above the 75th percentile in 8th grade Math may be appropriate candidates for advanced high school math coursework.
What grade level is a RIT score of 200?
A Math RIT score of 200 corresponds to approximately the 50th percentile for a 5th grader in Fall, or slightly below average for a 6th grader — placing it in the upper-elementary to early-middle school range. In Reading, a RIT of 200 corresponds to approximately the 45th–55th percentile for a 7th or 8th grader in Fall. Context (grade, subject, and season) matters enormously when interpreting any specific RIT value.
What grade level is a RIT score of 210?
A Math RIT of 210 corresponds to approximately the 50th percentile for a 6th grader in Fall — solidly at the national average for the start of middle school. In Reading, 210 represents above-average performance for most middle school grades, falling around the 60th–70th percentile range for Grades 6–8. Always verify the exact percentile using the full score tables on this page for your child’s specific grade and test season.
What grade level is a RIT score of 220?
A Math RIT of 220 falls at approximately the 50th percentile for a 7th or 8th grader in Fall — it is a solidly middle-school-level score representing good command of pre-algebra concepts. In Reading, a RIT of 220 is above average for most middle school grades and approaches upper-middle school reading levels. For elementary students achieving a 220 RIT in Math, this represents performance well above grade level.
Is 220 a good MAP score?
A RIT of 220 is a strong score for elementary students and a solid average score for middle school students — whether it is “good” depends entirely on your child’s grade. For a 5th grader, a Fall Math RIT of 220 is above the 90th percentile (exceptional). For a 7th grader, it sits near the national average for that grade. Always interpret any RIT score relative to grade-level norms using the tables on this page.
What is the average MAP score for 5th grade?
The national average (50th percentile) for 5th grade is approximately RIT 206 in Math and RIT 195 in Reading for Fall testing. By Spring, the 50th percentile rises to approximately RIT 216 in Math and RIT 202 in Reading, reflecting expected growth across the school year. These figures come from NWEA’s 2025 national norming study of over 7 million students.
What is the average MAP score for 7th grade?
The national average for 7th grade is approximately RIT 217 in Math and RIT 199 in Reading for Fall testing. By Spring, the 50th percentile rises to approximately RIT 223 in Math and RIT 204 in Reading. A 7th grader scoring above RIT 229 in Math is performing above the national average for their grade, which places them on a strong trajectory toward high school algebra coursework.
Does the MAP test affect grades?
No — the MAP Growth assessment does not affect a student’s report card grade in any subject. It is a diagnostic tool used entirely to help teachers understand where students are academically and to plan appropriate instruction. However, some schools track whether students participated in all three testing windows, and that participation may be noted in student records.
How long is the MAP test?
Most students complete the MAP Growth test in 45 to 60 minutes per subject. The test is computer-adaptive with approximately 40–55 questions, though the exact number varies for each student because the adaptive algorithm selects questions based on performance. Younger students in Kindergarten and Grade 1 may take the assessment over two shorter sessions. Students who complete the test in under 30 minutes may have rushed, which can affect the accuracy of the score.
How many questions are on the MAP test?
The MAP Growth assessment typically contains 40 to 55 questions per subject, but because the test is adaptive, no two students see the same set of questions and the exact count varies. Students who perform very well may see slightly more questions as the algorithm refines the score at higher difficulty levels. The adaptive design means each student’s test is uniquely calibrated to their ability level.
What happens if you don’t finish the MAP test?
Most schools allow students to pause and resume an incomplete MAP assessment in a subsequent session, with progress saved. However, if a student’s session is interrupted significantly or they do not engage carefully with the questions, the resulting score will not accurately reflect their true ability. Teachers typically receive a flag when a diagnostic was not completed under standard conditions, and may request a retest before using the results for instructional planning.
How to prepare for the MAP test?
The best preparation for MAP Growth is consistent engagement with school curriculum throughout the year — the test is designed to measure genuine learning, and short-term cramming has minimal effect on an adaptive assessment. The most helpful practical steps are ensuring your child is well-rested on test day, not rushed, and understands that the test is supposed to get harder as they do well. Reducing test anxiety is often more valuable than any last-minute academic preparation.
What is the highest possible MAP score?
The NWEA RIT scale has no published hard maximum, but in practice K–12 students very rarely score above RIT 265. The 99th percentile for Grade 12 in Math sits at approximately 265, meaning almost no student tested will score higher. Any score above approximately 260 for a K–12 student represents truly exceptional performance — well beyond what most high school curricula cover.
What grades take the MAP test?
MAP Growth is officially normed for Grades K through 12, though it is most commonly used in Grades K through 8. The official NWEA norms tables cover K–12, but high school adoption is less common than elementary and middle school. Some districts also use MAP Growth in early childhood programs. Whether and at which grades a school uses MAP Growth is a school or district decision.
How often is the MAP test given?
Most schools that use MAP Growth administer it three times per year — Fall (beginning of year), Winter (middle of year), and Spring (end of year). Some schools test twice per year (Fall and Spring only). NWEA’s research shows that three-season testing provides the richest picture of student growth and the most actionable data for teachers. The specific testing windows vary by school but generally follow the Fall/Winter/Spring schedule shown on this page.
What is “typical growth” on the MAP report?
Typical growth is the number of RIT points NWEA expects a student to gain between two test dates, based on their grade level and starting score. It is not the same for every student — students who start below grade level are typically expected to grow more than students who start above grade level. Comparing your child’s actual growth to their typical growth target is one of the most useful things you can do with MAP results.
Why did my child’s MAP score go down?
A genuine drop in RIT score between seasons is uncommon but possible if a student was unwell, anxious, rushing, or disengaged during the test. More commonly, what appears as a drop is actually a lower percentile despite a similar or slightly higher RIT score — because the national average increases from season to season. Always compare the actual RIT score numbers (not the percentiles) when assessing growth from Fall to Winter or Winter to Spring.
What is the difference between Fall, Winter, and Spring MAP scores?
Fall, Winter, and Spring MAP scores are compared against separate national norming tables calibrated to each point in the school year. Fall norms are lowest (students have just started the year), Spring norms are highest (students have completed a full year of instruction). You cannot compare a Fall score to a Spring percentile — always use the season-matched table. The RIT scale itself is continuous and comparable across seasons; only the percentile conversions differ.
What does the Lexile range mean on the MAP Reading report?
The Lexile range on a MAP Reading report shows the text complexity level your child can read and comprehend comfortably. A range like 750L–1000L means your child can independently access texts of that difficulty. You can use this range immediately — search any book title on the Lexile Framework website (lexile.com) to find its Lexile level and match it to your child’s range. This is one of the most practical pieces of information on the entire MAP report.
How are NWEA MAP scores used by teachers?
Teachers use MAP Growth results to form small instructional groups, identify which students need enrichment or intervention, assign differentiated work, monitor whether students are growing as expected between Fall and Spring, and communicate progress to parents at conferences. At the school and district level, MAP data is used for program evaluation, resource allocation, and state accountability reporting. It is one of the most data-rich tools available to K–12 educators.
Is NWEA MAP the same as the state test?
No — MAP Growth is a separate assessment from your state’s standardized accountability test. State tests (such as SBAC, PARCC, or state-specific assessments) are administered once per year and used for school accountability and federal reporting requirements. MAP Growth is a diagnostic tool used internally by schools to monitor student progress throughout the year. The two assessments are correlated but measure different things and produce different score types.
How does MAP compare to iReady?
Both MAP Growth (by NWEA) and the iReady Diagnostic (by Curriculum Associates, now rebranded as iReady Inform for 2026–2027) are adaptive diagnostic assessments used to measure student achievement and growth. MAP Growth is more widely used at the middle and high school level and produces RIT scores on a 100–300 scale; iReady is more common in K–8 settings and produces scale scores on a different range. The two assessments are not directly comparable — scores cannot be converted between systems.
What resources help improve MAP scores?
The most effective free resource for improving MAP scores is Khan Academy, which offers complete, grade-aligned K–12 content in both Math and Reading/ELA that directly maps to the skills assessed on MAP Growth. For Math specifically, daily fact fluency practice (multiplication and division for Grades 3+) and targeted work on whichever Goal Area scored lowest on your child’s MAP report will produce the most measurable improvement. Speaking with the classroom teacher about which specific skills are being targeted in instruction is always the highest-value first step.
Where Can I See the Official NWEA Map Score Chart by Grade Level for 2025 and 2026 in Math and Reading?
The NWEA Map Test Score Charts at readyscores.com/nwea-map-test-scores are the official, updated NWEA Map Score Charts by Grade Level for 2025 and 2026 in Math and Reading. These Map Score Charts show the national NWEA Map Scores by percentile, so you can easily understand how your child scored compared to the national average.
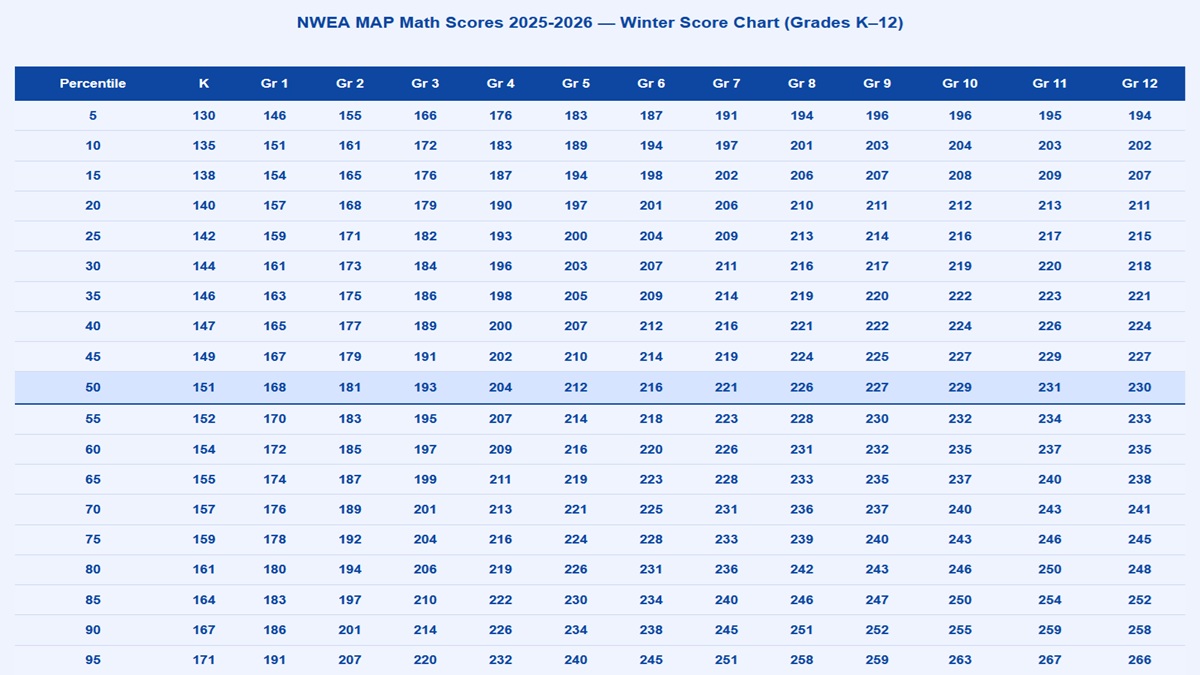
Let’s say your child is in Grade 5 and their school tested them in Winter. Their MAP report shows a Math RIT score of 215.
Step 1: Go to the NWEA MAP Math Winter chart above and find the Gr 5 column.
Step 2: Scan down the Gr 5 column. You can see that 215 sits between the 55th percentile row (214) and the 60th percentile row (216). A score of 215 is therefore at approximately the 55th–60th percentile.
Step 3: This means your child scored higher than approximately 55–60% of 5th grade students nationally who were tested at the same time of year in Winter.
Sources:
Official NWEA Website
NWEA on Wikipedia
NWEA MAP Test Login
Other NWEA MAP Resources
NWEA MAP Test Scores by Grade Level
NWEA MAP Math Scores by Grade
NWEA MAP Reading Scores by Grade
NWEA MAP Language Scores by Grade
NWEA MAP Science Scores by Grade
Free NWEA MAP Score Calculator
Free NWEA MAP Growth Tracker
What Is a Good NWEA MAP Score?
NWEA MAP Test Frequently Asked Questions
How to Understand and Improve NWEA MAP Scores
What to Do When an NWEA MAP Score Is Below Grade Level
Do you have a question about the test? Email me at [email protected].