What Is a Good iReady Score? 2026 i-Ready Score Chart by Grade & Placement Levels
Your child just received an iReady Diagnostic score. You have a number, but what does it actually mean? This guide shows you exactly how to find your child’s placement level using the official score charts for every grade K through 12, and gives you a concrete action plan based on where they land. Both Math and Reading are covered.
How iReady Scores Work: What You Need to Know First
iReady places every student on a continuous scale score ranging from 100 to 800. This single number measures reading or math performance across all grades on one unified scale. But the scale score alone tells you very little — a score of 500 is advanced for a 3rd grader and below average for a 7th grader. What matters is where your child’s score falls relative to their grade level.
That grade-level comparison produces a placement level — the most important piece of information on any iReady report. iReady uses a color-coded system to communicate placement clearly:
| Color / Zone | Placement Level | What It Means |
|---|---|---|
| ▮ Dark Green | Mid / Late On Grade Level | Fully meeting grade-level expectations |
| ▮ Light Green | Early On Grade Level | Partially meeting grade-level expectations |
| ▮ Blue / Purple | Above Grade Level | Surpassing grade-level expectations |
| ▮ Yellow | One Grade Level Below | Approaching grade level — needs support |
| ▮ Red | Two or More Grade Levels Below | Requires targeted intervention |
For a complete guide to all placement labels and what each one means, see our iReady Placement Levels guide.
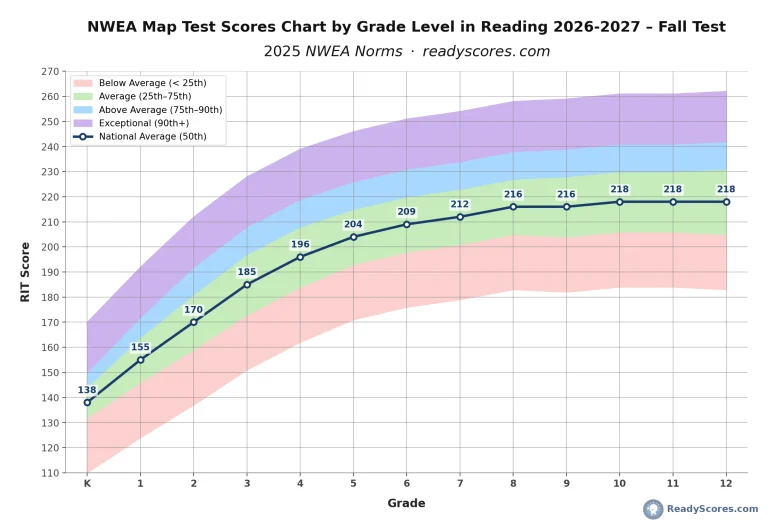
iReady Diagnostic Score Chart Reading by Grade — 2026–2027
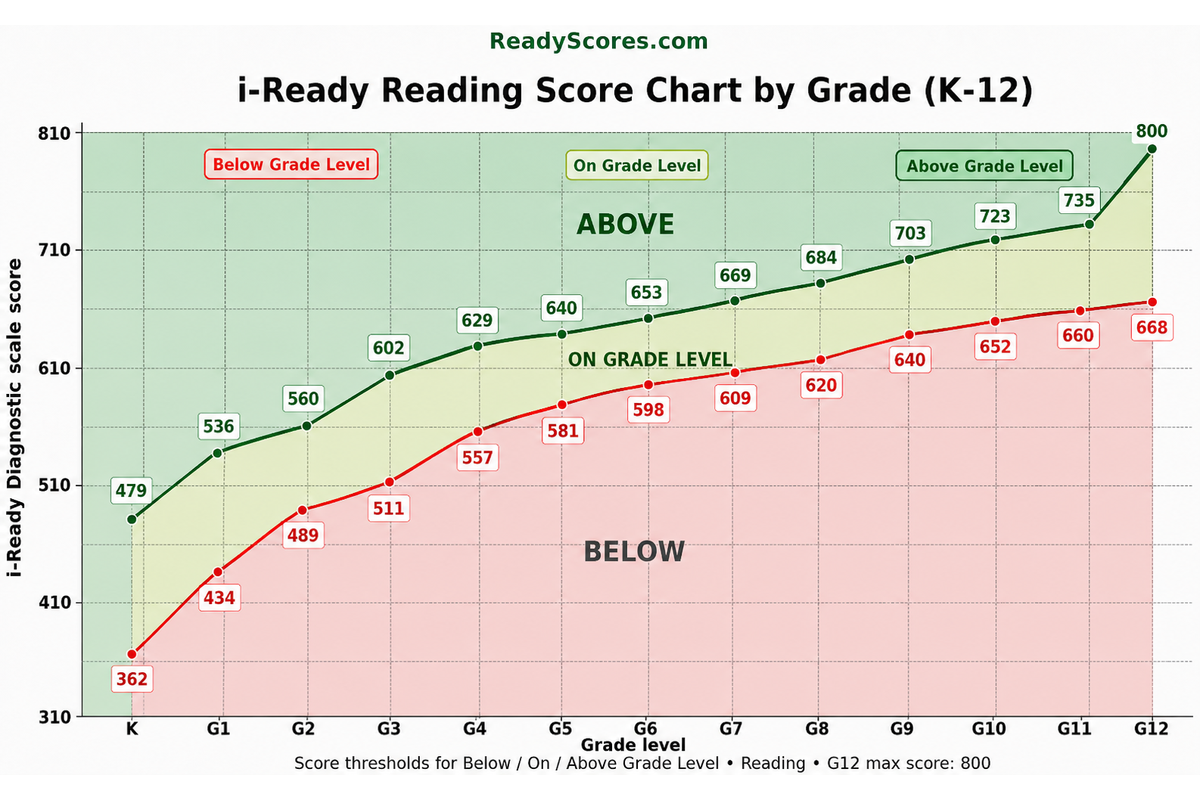
How to use this chart: Find your child’s grade on the bottom axis. Find their scale score on the vertical axis. The color zone where the two meet shows their placement level. The green band is on grade level. Above the green band is above grade level. Below is below grade level.
iReady Reading On-Grade Level Score Ranges 2025–2026 and 2026–2027 (K–12)
The table below shows the minimum and maximum scores for the On Grade Level band in Reading for every grade. A score below the minimum means your child is below grade level. A score above the maximum means they are above grade level.
| Grade | Below Grade Level | On Grade Level Range | Above Grade Level |
|---|---|---|---|
| K | Below 362 | 362 – 479 | 480 and above |
| Grade 1 | Below 434 | 434 – 536 | 537 and above |
| Grade 2 | Below 489 | 489 – 560 | 561 and above |
| Grade 3 | Below 511 | 511 – 602 | 603 and above |
| Grade 4 | Below 557 | 557 – 629 | 630 and above |
| Grade 5 | Below 581 | 581 – 640 | 641 and above |
| Grade 6 | Below 598 | 598 – 653 | 654 and above |
| Grade 7 | Below 609 | 609 – 669 | 670 and above |
| Grade 8 | Below 620 | 620 – 684 | 685 and above |
| Grade 9 | Below 640 | 640 – 703 | 704 and above |
| Grade 10 | Below 652 | 652 – 723 | 724 and above |
| Grade 11 | Below 660 | 660 – 735 | 736 and above |
| Grade 12 | Below 668 | 668 – 800 | — |
Source: Official iReady 2025–2026 Diagnostic Placement Tables, Curriculum Associates. For the complete Fall, Winter, and Spring percentile score charts for Reading (Grades K–8), see our iReady Reading Score Charts page.
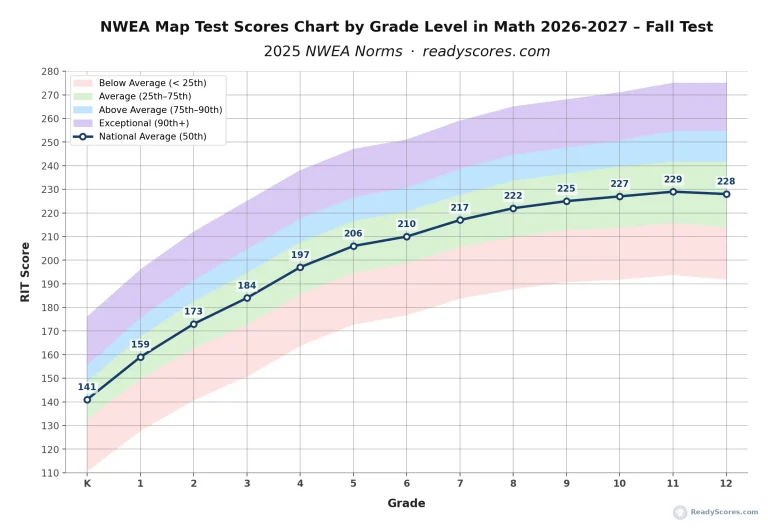
iReady Score Chart Math by Grade — 2026–2027
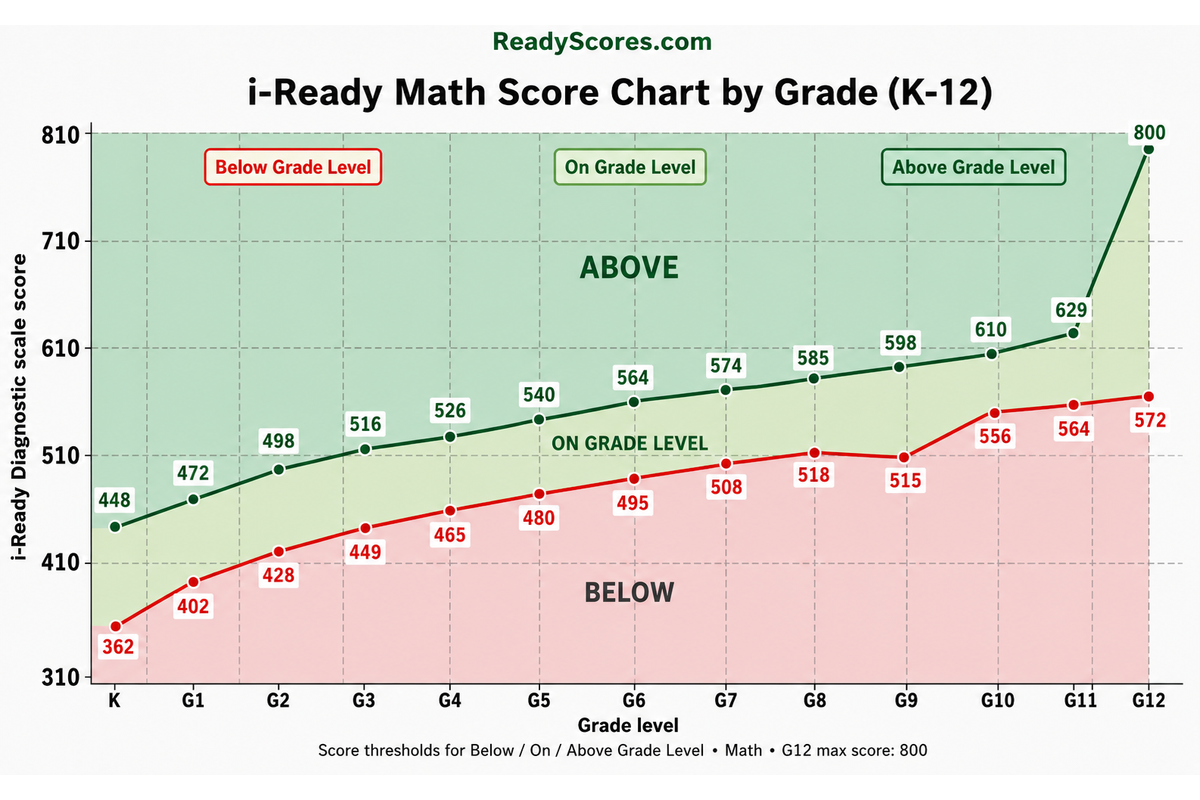
How to use this chart: Find your child’s grade on the bottom axis. Match their Math scale score to the vertical axis. The color zone where the two intersect is their placement level for Math. The green band represents on grade level performance.
iReady Math On-Grade Level Score Ranges 2025–2026 and 2026–2027 (K–12)
| Grade | Below Grade Level | On Grade Level Range | Above Grade Level |
|---|---|---|---|
| K | Below 362 | 362 – 448 | 449 and above |
| Grade 1 | Below 402 | 402 – 472 | 473 and above |
| Grade 2 | Below 428 | 428 – 498 | 499 and above |
| Grade 3 | Below 449 | 449 – 516 | 517 and above |
| Grade 4 | Below 465 | 465 – 526 | 527 and above |
| Grade 5 | Below 480 | 480 – 540 | 541 and above |
| Grade 6 | Below 495 | 495 – 564 | 565 and above |
| Grade 7 | Below 508 | 508 – 574 | 575 and above |
| Grade 8 | Below 518 | 518 – 585 | 586 and above |
| Grade 9 | Below 515 | 515 – 598 | 599 and above |
| Grade 10 | Below 556 | 556 – 610 | 611 and above |
| Grade 11 | Below 564 | 564 – 629 | 630 and above |
| Grade 12 | Below 572 | 572 – 800 | — |
Source: Official iReady 2025–2026 Diagnostic Placement Tables, Curriculum Associates. For the complete Math score chart with all percentiles (Grades K–8), see our iReady Math Score Charts page.
What Your Placement Level Actually Means — and What to Do Next
The most important question after seeing an iReady score is not “is this good or bad” but “what do I do now?” Here is a concrete action plan for every placement level. Use the iReady Placement Levels guide if you need more detail on exactly what each label means.
Your child has surpassed the grade-level benchmarks. This is an excellent result. The risk here is boredom — students performing above grade level who are not challenged can disengage and plateau. Action steps:
- Talk to the teacher about whether accelerated or differentiated work is available
- Look into gifted programs or math competitions (AMC 8 for grades 6-8)
- Use the domain breakdown — even above-grade-level students have a weakest domain
- Set the next iReady diagnostic as a growth target — maintaining the lead requires continued challenge
- Track progress with our iReady Growth Tracker
Your child is meeting grade-level expectations. This is a solid result that deserves recognition — it means they are ready to engage with their current curriculum and on track for grade-level goals. Action steps:
- Maintain consistent reading or math practice (20-30 minutes daily for reading)
- Complete iReady lessons regularly — 30-49 minutes per week is the research-backed target
- Review the domain breakdown to identify any one area lagging behind
- Set the Stretch Growth target as the goal for the next diagnostic window
- Use our iReady Score Calculator to estimate your growth target
Your child is within the on-grade band but at the lower end — they have partially met expectations. This is not a red flag; it is a signal to focus. Action steps:
- Identify the one or two weakest domains from the domain breakdown and target them specifically
- Ask the teacher what skills are most important to consolidate before the next test window
- Increase iReady lesson time to 60 minutes per week if possible
- Read our guide: What to Do After Getting Your Child’s iReady Score Report
Your child is below the grade-level benchmark. This does not mean they cannot catch up — students move levels every year with focused effort and the right support. Action steps:
- Request a meeting with the teacher. Ask what intervention support is already in place at school.
- Focus on the specific domain(s) flagged as weakest — targeted practice in one area moves scores faster than broad practice
- Consider supplemental support outside of school if in-school intervention is limited
- Set a realistic growth target: aim for Typical Growth as a floor, not a ceiling
- Read: My Child’s iReady Score Is Below Grade Level — What Do I Do?
- Track every diagnostic with our iReady Growth Tracker so progress is visible and motivating
The Domain Breakdown: Where the Real Insight Lives
The overall scale score is the headline. The domain breakdown is the story. Two students with identical overall scores can have completely different strengths and gaps — and need completely different support. Always look one level deeper.
| Subject | Domains Measured |
|---|---|
| Reading | Phonological Awareness & Phonics · Vocabulary · Comprehension: Literature · Comprehension: Informational Text |
| Math | Number & Operations · Algebra & Algebraic Thinking · Measurement & Data · Geometry |
Each domain gets its own placement level. Find the one domain that is rated lower than the others and make it the focus of practice. Do not try to fix everything at once — concentrated effort on one weak area produces faster overall score improvement than scattered practice across all areas.
For Reading, the iReady report also includes a Lexile level — a measure of reading text complexity that you can use to find books at the right challenge level. For Math, it includes a Quantile measure that identifies which specific math skills your child is ready to learn next.
Typical Growth vs Stretch Growth: Setting the Right Target
After each diagnostic, iReady provides two growth benchmarks for the year:
| Benchmark | What It Means | Who Should Use It |
|---|---|---|
| Typical Growth | The expected scale score gain for a student at this grade and starting level over one school year | Minimum target for all students — floor, not ceiling |
| Stretch Growth | A more ambitious target reflecting above-average effort and above-average progress | Goal for students who are engaged and receiving consistent support |
Use Typical Growth as your baseline — clearing this benchmark means your child is keeping pace with expected annual progress. If your child is receiving extra support or doing consistent practice outside school, aim for Stretch Growth instead. Students who hit Stretch Growth targets consistently often move up a placement level or more by the end of the year.
Track your child’s growth across all three testing windows (Fall, Winter, Spring) with our iReady Growth Tracker. It calculates whether your child is on pace for Typical or Stretch Growth based on Fall and Winter results.
Why Season Matters: Fall, Winter, and Spring Scores Are Not Interchangeable
This is the most important thing the score charts above cannot show you — and something Think Academy’s article does not cover. The placement zones on the charts above are for the 2025–2026 school year overall. But iReady actually sets three separate norm windows per year: Fall, Winter, and Spring. The national average in Spring is a higher scale score than in Fall, because all students are expected to grow.
The placement level labels on your child’s report do account for season — iReady calculates placement against the correct window automatically. But if you are looking up your child’s score on the charts above, use the Fall chart for a Fall score, the Winter chart for a Winter score, and the Spring chart for a Spring score.
Our full iReady Reading Score Charts and iReady Math Score Charts include separate Fall, Winter, and Spring percentile tables for every grade K–8. Use those for precise percentile lookups — not the charts above, which show placement zones only.
Common Questions About iReady Scores
Is my child’s iReady score used for promotion or grade retention?
In most districts, iReady scores alone do not determine grade promotion. However, some states use iReady data as one input among several for decisions about reading intervention, summer school placement, and in some cases grade retention — particularly for 3rd grade Reading under state reading proficiency laws. Check with your school district for its specific policy.
Why did my child’s score go down between diagnostics?
A score drop from Spring to the following Fall is common and expected — it is caused by the “summer slide,” the well-documented loss of academic skills during summer break. A score drop within the same year (Fall to Winter, or Winter to Spring) is worth discussing with the teacher. It can result from test conditions, effort level, or a genuine skill gap that has emerged. Review the domain breakdown for clues about where the issue lies. Read more in our guide: My Child’s iReady Score Is Below Grade Level.
What is a “good” iReady score?
A good iReady score is any score that falls within or above the On Grade Level band for your child’s grade — see the tables above for exact ranges. More important than a single “good” number is consistent growth: a child who moves from Early On Grade Level to Mid On Grade Level in one year has done something genuinely impressive, even if neither score looks impressive as a raw number. Use our iReady FAQ for answers to more common score questions.
What does iReady Inform mean — is it different from iReady Diagnostic?
Starting in the 2026–2027 school year, Curriculum Associates is officially renaming the iReady Diagnostic to iReady Inform. The scoring system, scale, and norms do not change — only the name. A score from 2024 and a score from 2027 are directly comparable on the same scale. See all iReady scores and charts at the iReady Diagnostic Scores hub.
🔗 More iReady Resources on ReadyScores.com
- iReady Reading Score Charts — Fall, Winter & Spring Percentiles (Grades K–8)
- iReady Math Score Charts — Fall, Winter & Spring Percentiles (Grades K–8)
- iReady Diagnostic Scores — Complete Guide and Hub
- iReady Levels AA through H — What They Mean by Grade
- iReady Placement Levels — Full Explanation of Every Label
- iReady Score Calculator — Estimate Your Growth Target
- iReady Growth Tracker — Track All Three Diagnostic Windows
- iReady FAQ — 30 Common Score Questions Answered
- What to Do After Getting Your Child’s iReady Score Report
- My Child’s iReady Score Is Below Grade Level — What Now?
Sources: Official iReady 2025–2026 Diagnostic Placement Tables, Curriculum Associates. Score charts based on official 2025–2026 academic placement data. Placement zone boundaries verified against Curriculum Associates official norms. ReadyScores.com is not affiliated with or endorsed by Curriculum Associates.