
What is a Good NWEA Map Score (by Grade) – Understand RIT, Percentiles & Map Growth reports
What is a Good NWEA Map Score (by Grade) – Learn to Interpret RIT Scores, Percentiles & Map Growth Reports.
Explore more NWEA MAP score charts and tools:
📊 NWEA MAP scores overview by grade →
📐 NWEA MAP Math scores by grade →
🔬 NWEA MAP Science score chart →
📖 NWEA MAP Reading scores by grade →
✍️ NWEA MAP Language scores guide →
🧮 NWEA MAP score calculator and meaning →
💡 How to improve after a MAP report →
💡 What parents can do after NWEA MAP results →
📋 MAP score below grade level — next steps →
📋 What to do if your child scored below grade →
📈 NWEA MAP Growth Tracker tool →
📈 Free MAP growth tracking tool →
📋 What is a good MAP score by grade? →
📋 Good MAP scores explained by grade →
❓ NWEA MAP test FAQ for parents →
MAP is not a pass/fail test
Before looking at any numbers, it is important to understand what MAP Growth is designed to do. It is a growth assessment — its purpose is not to deliver a one-time verdict on your child’s ability, but to measure how much they are progressing over the school year. The most meaningful question is not “did my child pass?” but:
“Is my child learning and growing at a healthy rate?”
This is why schools administer the test multiple times per year — typically in fall, winter, and spring. A single score is a snapshot. The trend across those snapshots tells the real story.
Decoding the numbers: RIT scores and percentiles
Your child’s report contains two key metrics that answer two different questions.
What is a RIT score?
The RIT score (short for Rasch Unit) is your child’s overall score on the test. It is a stable, equal-interval scale — like a ruler — that measures academic knowledge. As your child learns and grows, their RIT score is expected to increase over time.
- What it tells you: The difficulty level of questions your child is ready to tackle. A higher RIT score means a student is ready for more complex material.
- What to remember: RIT scales are different for each subject. A Math RIT score cannot be directly compared to a Reading RIT score — think of them as two separate rulers measuring different dimensions.
- The scale is grade-independent: A RIT score of 210 means the same level of academic difficulty whether a student is in Grade 3 or Grade 7. This is what makes it useful for tracking progress across multiple years.
What is a (Map Score) percentile ranking?
The percentile shows how your child’s RIT score compares to other students in the same grade nationwide who took the test in the same season. It answers the question: how does my child’s performance compare to their peers?
A student in the 95th percentile did not answer 95% of the questions correctly. Because MAP is adaptive, they were challenged with very difficult questions. A high percentile means they correctly answered questions at a much higher difficulty level than most of their peers.
Achievement vs. growth: why both matter
MAP Growth reports two separate percentile measures that parents sometimes confuse. Understanding the difference between them is one of the most important things you can do with your child’s report.
Achievement percentile
Answers: How does my child compare to other students in the same grade nationally? The 50th percentile means your child is exactly at the national average. The 75th means they outperformed 75% of peers.
Conditional Growth Percentile (CGP)
Answers: How much did my child grow compared to students who started at the same level? A CGP at the 50th percentile means typical growth. Above the 50th means your child is growing faster than most students who began at the same starting point.
A student at the 40th percentile in achievement but the 70th in growth is learning quickly and catching up. A student at the 95th percentile in achievement but the 30th in growth may need more challenge to stay engaged. Neither number alone gives the full picture.
2025 MAP Math norms: achievement and growth by grade
The table below presents official 2025 NWEA MAP Math achievement norms — mean RIT scores for fall, winter, and spring — along with typical fall-to-spring growth. These figures represent national averages across millions of students and are the current benchmark used by schools in the 2025–26 school year.
Please, also visit the complete page of NWEA Map Score Chart with Percentiles by Grade Level (Math and Reading).
| Grade | Fall RIT | Winter RIT | Spring RIT | Typical fall–spring growth |
|---|---|---|---|---|
| Kindergarten | 141 | 151 | 158 | +17 |
| Grade 1 | 159 | 169 | 174 | +16 |
| Grade 2 | 176 | 183 | 188 | +15 |
| Grade 3 | 190 | 195 | 199 | +11 |
| Grade 4 | 201 | 206 | 209 | +9 |
| Grade 5 | 211 | 215 | 218 | +8 |
| Grade 6 | 218 | 221 | 223 | +7 |
| Grade 7 | 222 | 225 | 227 | +6 |
| Grade 8 | 225 | 227 | 229 | +5 |
| Grade 9 | 226 | 228 | 230 | +4 |
| Grade 10 | 229 | 231 | 232 | +4 |
| Grade 11 | 231 | 233 | 234 | +3 |
| Grade 12 | 232 | 233 | 234 | +2 |
Note: Growth naturally slows as students advance. A Grade 1 student growing 16 points and a Grade 8 student growing 5 points may both be making excellent, on-track progress. Smaller gains in middle and high school are expected and normal.
2025 MAP Reading norms: achievement and growth by grade
The table below presents official 2025 NWEA MAP Reading achievement norms. Reading growth follows a different pattern from Math — gains are more gradual across the year, especially in upper grades, and small increases between seasons are meaningful and expected. By Grade 9, Reading RIT scores begin to plateau, which reflects the nature of advanced reading comprehension rather than a lack of progress.
Please, also visit the complete page of NWEA Map Score Chart with Percentiles by Grade Level (Math and Reading).
| Grade | Fall RIT | Winter RIT | Spring RIT | Typical fall–spring growth |
|---|---|---|---|---|
| Kindergarten | 138 | 146 | 152 | +14 |
| Grade 1 | 155 | 163 | 168 | +12 |
| Grade 2 | 170 | 177 | 182 | +12 |
| Grade 3 | 185 | 190 | 194 | +9 |
| Grade 4 | 196 | 199 | 202 | +6 |
| Grade 5 | 204 | 206 | 208 | +5 |
| Grade 6 | 209 | 211 | 212 | +3 |
| Grade 7 | 212 | 214 | 215 | +2 |
| Grade 8 | 216 | 217 | 218 | +2 |
| Grade 9 | 216 | 217 | 217 | +1 |
| Grade 10 | 218 | 218 | 218 | 0 |
| Grade 11 | 218 | 218 | 218 | 0 |
| Grade 12 | 218 | 217 | 216 | −1 |
Note: Flat or near-zero Reading growth in Grades 9–12 is expected and does not indicate a problem. MAP Reading is calibrated for foundational to grade-common skills; advanced literary analysis developed in high school English may not fully register as RIT gains.
NWEA updated its MAP Growth norms in 2025 using data from 13.8 million students across 30,000 schools. The RIT scale itself did not change — but the national reference group was refreshed, which means a given RIT score may now correspond to a slightly different percentile than it did under the previous 2020 norms. Under the 2025 norms, the same RIT score will generally map to a higher percentile than before, since national performance has shifted.
Gifted and advanced program benchmarks
Many parents want to know whether their child’s MAP scores might qualify them for gifted and talented (GATE) programs, accelerated tracks, or selective school admissions. While specific criteria vary significantly by school and district, the table below provides general RIT benchmarks typically associated with the 90th and 95th percentile by grade — the thresholds most commonly used by gifted programs.
| Grade | Math 90th pct | Math 95th pct | Reading 90th pct | Reading 95th pct |
|---|---|---|---|---|
| Grade 3 | 215 | 222 | 210 | 216 |
| Grade 4 | 223 | 231 | 216 | 222 |
| Grade 5 | 232 | 240 | 220 | 226 |
| Grade 6 | 238 | 246 | 224 | 230 |
| Grade 7 | 242 | 250 | 227 | 233 |
| Grade 8 | 245 | 254 | 229 | 235 |
These are approximations based on 2025 NWEA norm distributions. Always verify specific gifted program thresholds with your school or district.
MAP scores are one factor in gifted program placement — not the only one. Schools often also consider classroom performance, teacher recommendations, IQ assessments, and demonstrated creative or critical thinking. A student who narrowly misses a MAP cutoff may still qualify; a student who exceeds it is not automatically placed.
The five types of MAP Growth reports
MAP Growth produces a portfolio of reports for different audiences. As a parent, you will typically receive the Family Report, but understanding what other reports exist helps you know what data your child’s school and teachers are working with.
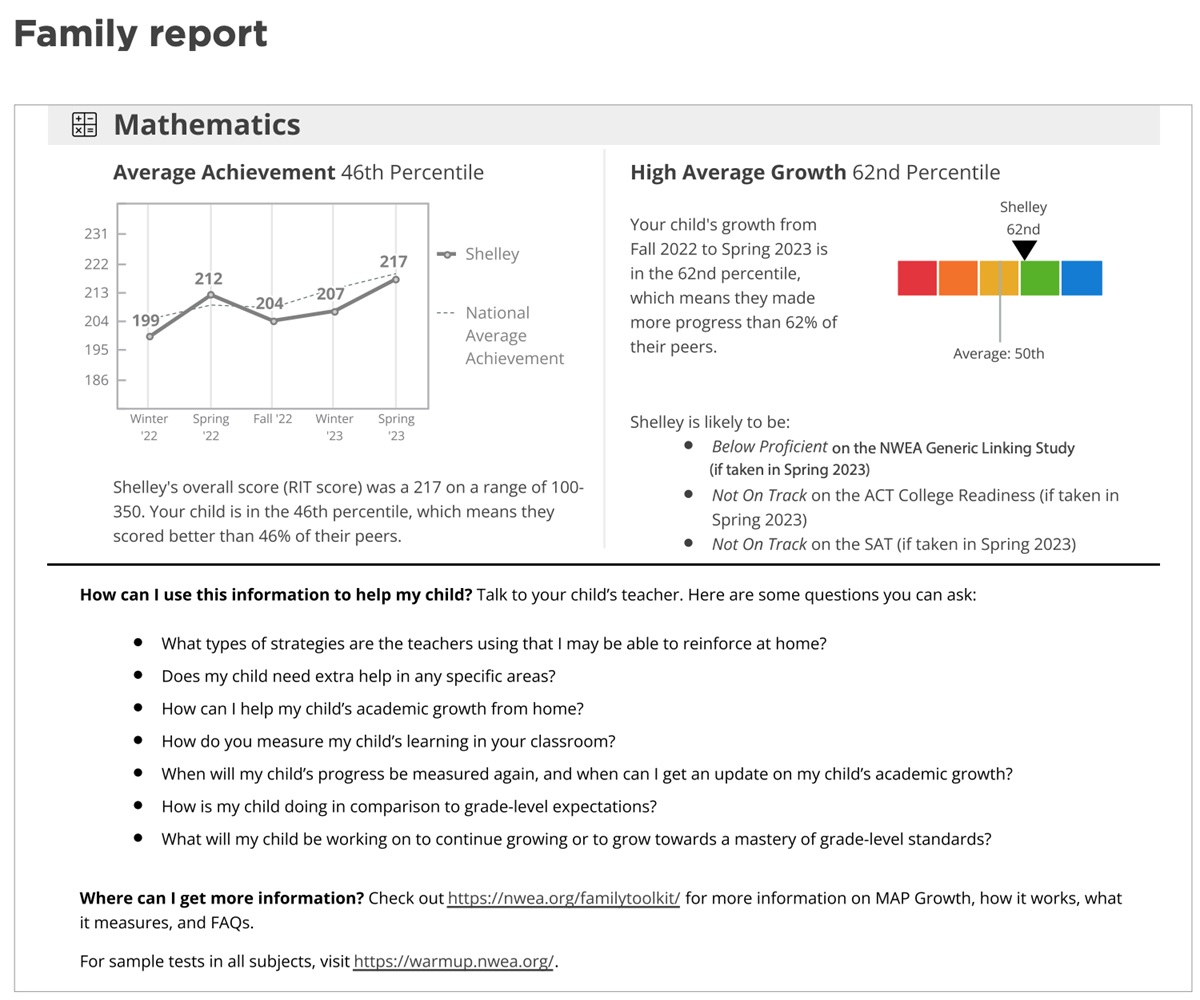
1. Family Report — what parents receive
This is the primary report designed for parents and caregivers. It presents your child’s most recent test results in an accessible format and is the starting point for parent-teacher conversations.
- RIT score for each subject tested (Reading, Math, Language Usage, and Science where applicable)
- Achievement percentile showing performance compared to students nationwide
- Growth percentile (CGP) showing improvement compared to students who started at the same level
- A visual chart tracking RIT scores across fall, winter, and spring testing windows
- Lexile range (for Reading), which can be used immediately to find age-appropriate books
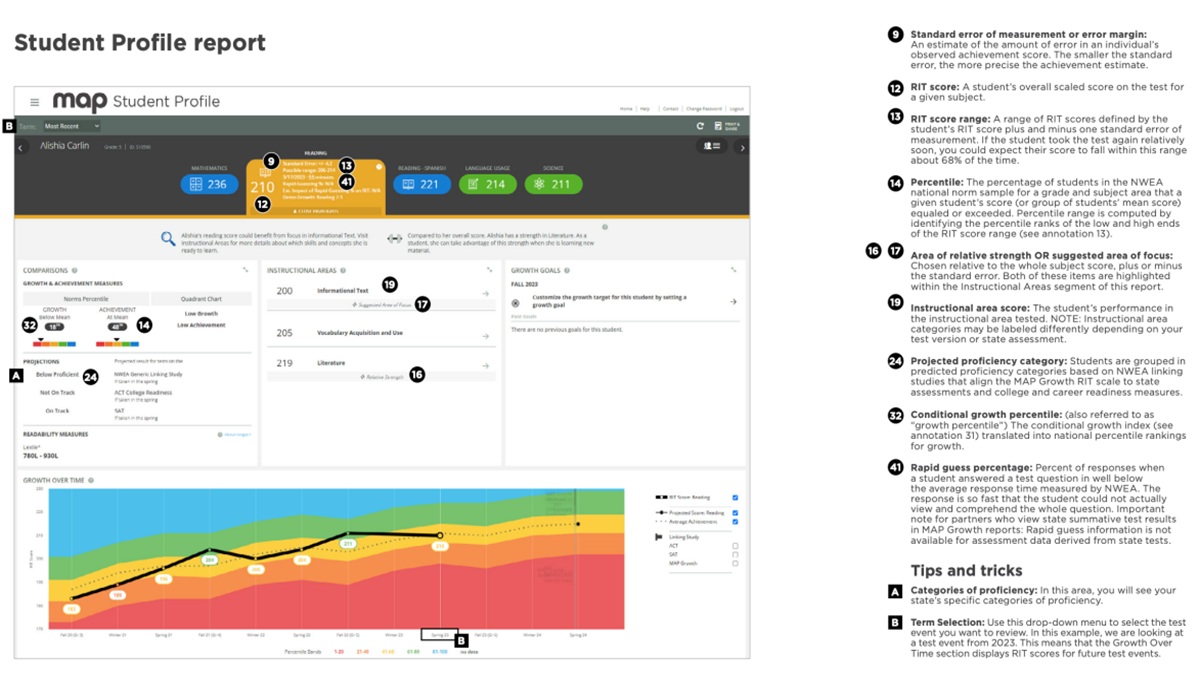
2. Student Profile Report — what teachers use
Teachers use this detailed individual report to understand each student’s full learning journey and plan classroom instruction accordingly.
- Achievement data for every test event throughout the school year
- Growth measurements over time compared to national norms
- Projections for year-end state test performance
- Specific skill area breakdowns (e.g. Operations & Algebraic Thinking, Informational Text) showing strengths and areas for growth
3. Class Profile Report — classroom planning
This report gives teachers a bird’s-eye view of their entire class, helping them form instructional groups and identify students needing additional support or enrichment.
- Overall class performance in each subject compared to national norms
- Which students have completed testing vs. have pending results
- Rapid-guessing flags for students who may have rushed through the test
- Skill areas where the class as a whole is strong or struggling
4. School Profile Report — school-level decisions
School administrators use this aggregate data to make decisions about curriculum, resources, and intervention programs across the entire building.
- How each grade and class performs compared to national norms
- Which grades or cohorts may need additional instructional support
- Trends that can inform professional development priorities and curriculum adoption
- The measurable impact of previous instructional programs and initiatives
5. District Profile Report — system-wide strategy
District leaders use this comprehensive view to understand achievement and growth patterns across all schools in the system, informing policy and resource allocation at the highest level.
- Achievement and growth trends across all schools and grade levels
- Identification of schools outperforming or underperforming expectations
- Equity indicators showing performance gaps across demographic groups
- Longitudinal data to evaluate the impact of district-wide initiatives over time
How to interpret your child’s growth chart
Your Family Report includes a visual chart showing your child’s RIT scores across testing terms. Here is how to read the three most common patterns — and what to do about each one.
Steady upward trajectory
Scores rise consistently from fall to winter to spring. This is the ideal pattern. Even modest upward movement indicates healthy, consistent learning. Maintaining the same percentile while RIT increases is also a positive sign — it means your child is learning at pace with their peers nationally.
Flat or plateauing scores
Scores stay roughly the same across one or more terms. For high achievers, this may mean they need more challenge and are not being stretched. For students in the mid-range, it may signal difficulty keeping up with grade-level material. Either way, a flat line is worth a conversation with the teacher — not panic, but not silence either.
Declining scores
A dip from spring to fall (the “summer slide”) is common and normal — most students lose some ground over the summer, and it typically rebounds by winter. Declining scores during the school year, especially across two or more consecutive terms, warrant a closer look. One bad test day does not define a trend.
“Good growth” in practice
- Consistent upward RIT movement from fall to spring, even if gains are small
- Growth Percentile (CGP) at or above the 50th percentile — keeping pace with or outpacing typical growth
- Alignment between MAP results and what your child’s teacher observes in class
- Your child feeling appropriately challenged but not overwhelmed by day-to-day schoolwork
What to do after receiving MAP results
The MAP report is not a final grade — it is a tool for action. Here is a structured approach to turning your child’s results into meaningful next steps.
- Identify the specific goal areas. MAP breaks each subject into skill strands (e.g. Algebraic Thinking, Informational Text). Ask the teacher to identify your child’s top two strengths and top two areas for growth. Knowing exactly which skills need work is far more useful than a single score.
- Focus on growth, not just the number. Ask the teacher: “Is my child’s growth on track compared to national norms?” A child at the 40th percentile who is growing at the 70th percentile is making outstanding progress — that is the story worth celebrating.
- Ask when to consider additional support. If your child’s achievement percentile is consistently below the 25th and their growth is also below the 50th across multiple terms, that is a meaningful signal for intervention. Ask the teacher at what specific point they would recommend formal support.
- Build a small, consistent home routine. Fifteen minutes of targeted practice a few times per week on the identified goal areas is enough to make a meaningful difference. The teacher can suggest activities appropriate for your child’s current RIT level.
- Follow up before the next test window. Check in with the teacher a few weeks before the next MAP administration. The goal is a continuous learning loop between home and school — not a once-a-year conversation.
- Request a retest if circumstances were unusual. If your child was unwell, anxious, or rushing on test day, the results may not accurately reflect their current level. Retesting to get a more accurate baseline is sometimes appropriate — ask the teacher.
Five questions to ask at the next parent-teacher conference
- “Is my child’s growth on track compared to national norms for their grade and season?”
- “What are my child’s top two strengths and top two goal areas in each subject?”
- “How does my child’s MAP performance align with what you observe in the classroom?”
- “At what point would you recommend seeking additional support — or additional challenge?”
- “What is the most valuable thing I can do at home to support the areas where my child needs growth?”
Parents, Please Read This – Summary.
- Growth over rank. A child moving from the 30th to the 50th percentile is making outstanding progress. The growth percentile often matters more than the achievement percentile.
- One score is one snapshot. The trend across fall, winter, and spring is the real story. Never judge academic progress on a single test event.
- Slowing growth is normal. Math and Reading growth naturally decelerate in middle and high school. Smaller RIT gains in Grades 7–12 do not mean your child is falling behind.
- Use results as a conversation tool. The Family Report is designed to start productive dialogue with your child’s teacher — not to create stress at home.
- Subject scores are not comparable. A Reading RIT of 215 and a Math RIT of 215 do not mean the same thing — always compare each subject against its own grade-level norms.
Data sourced from the NWEA 2025 MAP Growth Norms (published August 2025). RIT scores and growth figures represent national student-level averages. Individual results vary. For complete percentile tables, visit the official NWEA norms documentation at nwea.org.
FAQ – NWEA Map Scores.
Frequently asked questions about NWEA MAP scores, what is considered a good NWEA Map score for each grade level, plus general questions about Map Growth, and how accurate Map Reports are.
Please, visit the complete NWEA Map Score FAQ, here.
What is considered a good MAP score?
A good MAP score is one that reflects both strong achievement and healthy growth — not a single number. Generally, scoring at or above the 50th percentile means your child is performing at or above the national average for their grade, while a score at the 75th percentile or higher indicates above-average achievement. More importantly, a good score is one that shows consistent upward growth across fall, winter, and spring testing windows, regardless of where the starting percentile sits.
What is the highest MAP score ever recorded?
NWEA has not officially published a single highest score ever recorded, but the upper boundary of the RIT scale is approximately 350. Scores above 300 are extremely rare and typically only seen in highly gifted students in upper grade levels — most high school students score in the 220–250 range. A score above 265 in any grade is considered exceptionally advanced by any reasonable benchmark.
What is a gifted NWEA MAP score?
A score at or above the 95th percentile is generally considered the threshold for gifted identification, which typically corresponds to a RIT score of around 240 or higher depending on grade and subject. However, gifted program eligibility varies widely by district — some use the 90th percentile as their cutoff, others require multiple assessments alongside MAP, and a few use different RIT thresholds entirely. Always check your specific school or district’s criteria.
Is a MAP score of 200 good?
A RIT score of 200 means very different things depending on the grade and subject. For a Grade 2 student in Math, a score of 200 is well above average; for a Grade 5 student, it falls below the national average. Always compare any RIT score against the grade-level norms for the correct season — a number without grade context tells you very little.
What is the average MAP score by grade?
Average MAP scores (50th percentile) rise steadily from around 141 in Kindergarten Math to approximately 234 in Grade 12 Math, and from around 138 in Kindergarten Reading to approximately 218 in Grades 10–12 Reading. The full grade-by-grade mean RIT scores for both Math and Reading are listed in the norm tables above, broken down by fall, winter, and spring testing windows.
How often do students take the MAP test?
Most schools administer MAP Growth three times per year — fall, winter, and spring — though some districts test only twice (fall and spring). The multi-window approach is intentional: comparing scores across all three seasons shows whether a student is growing at a healthy rate throughout the year, not just at one point in time.
Does MAP test preparation help?
MAP Growth is designed to measure a student’s actual academic level, not test-taking strategies, so last-minute cramming has limited effect. The most effective preparation is consistent academic engagement — regular reading, daily math practice, and strong classroom participation throughout the year. Familiarising a child with the computer-adaptive format can help reduce test anxiety and improve comfort on the day.
Can MAP scores be used for college admissions?
MAP Growth scores are not used directly in college admissions. They are a K–12 diagnostic and growth tracking tool, not a college readiness credential. That said, strong and consistent MAP growth throughout middle and high school often correlates with strong performance on college readiness assessments like the SAT, ACT, and AP exams.
What is the summer slide on the MAP test?
The summer slide refers to the common pattern of students’ RIT scores dipping slightly between the spring test and the following fall test. This happens because learning slows or reverses over the summer without structured academic engagement. A small fall-to-fall dip is normal and expected — the key indicator to watch is whether the score recovers and grows by winter and spring of the new school year.
What is a Conditional Growth Percentile (CGP) on the MAP test?
The Conditional Growth Percentile (CGP) measures how much a student grew compared to other students nationally who started at the same RIT score — not compared to all students in their grade. A CGP of 50 means the student grew at the typical rate for students who began at the same level. A CGP above 50 means they outgrew their peers; below 50 means their growth was slower than expected given their starting point.
What is the difference between student percentile and school percentile on MAP?
Student percentiles compare an individual child’s RIT score to other students nationwide in the same grade and season — this is the number on your child’s Family Report and the one parents should use. School percentiles compare a school’s average RIT score to other schools nationwide and are intended for administrators evaluating institutional performance. Using school percentiles to interpret an individual child’s results will give a misleading picture.
Why did my child’s MAP percentile stay the same even though their RIT score went up?
This is completely normal and actually a positive sign. If your child’s RIT score increased but their percentile held steady, it means they grew at roughly the same pace as other students nationally — everyone moved up together. A stable percentile with a rising RIT score confirms your child is learning consistently and keeping pace with peers. Percentile only changes when a student grows faster or slower than the national peer group.
Should my child study for the MAP test?
MAP Growth is not designed for traditional studying or cramming, and short-term test prep has minimal impact on results. The best approach is strong, consistent academic engagement throughout the school year — reading regularly, practising maths skills, and staying engaged in class. If your child experiences test anxiety, practising with a few sample adaptive questions beforehand can help with comfort and confidence on test day.
What is the Lexile range on the MAP Reading report?
A Lexile range is a measure of reading complexity that MAP translates from your child’s Reading RIT score. It gives you a practical, immediately usable tool: you can match books to your child’s current reading level by looking for books within their Lexile band. Most libraries and book retailers allow you to search by Lexile range, making it easy to find appropriately challenging reading material.
What does rapid guessing mean on the MAP report?
Rapid guessing is flagged when a student answers questions too quickly to have read them carefully — typically in under five seconds. It indicates the student may have rushed through the test, which can significantly deflate their score and make the results unreliable. If your child’s Class Profile or Student Profile shows a rapid-guessing flag, ask the teacher whether the results are considered valid or whether a retest is appropriate.
FAQ – What is a ‘Good’ NWEA Map score for each Grade.
What is a good MAP score for Kindergarten?
In Kindergarten, a good MAP score is one that falls at or above the national average for that testing season — approximately 141 in Math and 138 in Reading in the fall, rising to around 158 in Math and 152 in Reading by spring. Because Kindergarteners are just beginning formal assessment, growth and engagement with the test matter more than the raw number at this stage. A child at the 50th percentile or above who shows upward movement across the year is on a healthy track.
What is a good MAP score for Kindergarten in Math?
A good Kindergarten Math MAP score falls at or above the national mean for the relevant season: approximately 141 in fall, 151 in winter, and 158 in spring. Scores at the 75th percentile or above — roughly 153+ in fall and 170+ in spring — indicate above-average performance. At this age, consistent upward movement from fall to spring matters more than the absolute number.
What is a good MAP score for Kindergarten in Reading?
A good Kindergarten Reading MAP score sits at or above the national mean: approximately 138 in fall, 146 in winter, and 152 in spring. Scores above the 75th percentile — roughly 148+ in fall and 163+ in spring — are considered strong. Early reading growth in Kindergarten is highly predictive of long-term literacy development, so steady upward movement is the most important indicator to watch.
What is a good MAP score for 1st grade?
For Grade 1, the national average (50th percentile) is approximately 159 in Math and 155 in Reading in the fall, rising to around 174 in Math and 168 in Reading by spring. A score above the 75th percentile — roughly 173+ in Math and 181+ in Reading in spring — indicates above-average performance. First grade typically sees some of the largest year-on-year RIT growth, so a strong growth trajectory is a very positive sign.
What is a good MAP score for 1st grade in Math?
A good Grade 1 Math score is at or above the national mean of 159 in fall, 169 in winter, and 174 in spring. Scores above the 75th percentile — approximately 173 in fall and 186 in spring — reflect strong performance. Grade 1 Math typically sees average annual growth of around 16 RIT points, so a child growing at or above that rate is making excellent progress.
What is a good MAP score for 1st grade in Reading?
A good Grade 1 Reading score is at or above the national mean of 155 in fall, 163 in winter, and 168 in spring. Scores above the 75th percentile — approximately 167 in fall and 182 in spring — indicate above-average reading development. Reading growth in Grade 1 averages around 12 RIT points per year, driven heavily by phonics development and early fluency.
What is a good MAP score for 2nd grade?
For Grade 2, the national average is approximately 176 in Math and 170 in Reading in the fall, rising to around 188 in Math and 182 in Reading by spring. Scores above the 75th percentile — roughly 191+ in Math and 196+ in Reading by spring — reflect strong second-grade performance. This is typically the grade where reading fluency begins to consolidate, so steady Reading growth is especially meaningful.
What is a good MAP score for 2nd grade in Math?
A good Grade 2 Math MAP score is at or above the national mean: 176 in fall, 183 in winter, and 188 in spring. Above the 75th percentile corresponds to approximately 191 in fall and 200 in spring. Typical annual Math growth in Grade 2 is around 15 RIT points, reflecting the rapid skill-building that characterises early elementary mathematics.
What is a good MAP score for 2nd grade in Reading?
A good Grade 2 Reading MAP score is at or above the national mean: 170 in fall, 177 in winter, and 182 in spring. Above the 75th percentile corresponds to approximately 181 in fall and 196 in spring. Reading growth in Grade 2 averages around 12 RIT points per year — one of the stronger growth years for Reading before the pace begins to slow in upper elementary grades.
What is a good MAP score for 3rd grade?
For Grade 3, the national average is approximately 190 in Math and 185 in Reading in the fall, rising to 199 in Math and 194 in Reading by spring. Scores above the 75th percentile — roughly 206+ in Math and 207+ in Reading by spring — indicate strong third-grade performance. Grade 3 is a pivotal year academically, as students transition from learning to read to reading to learn, making Reading growth particularly significant.
What is a good MAP score for 3rd grade in Math?
A good Grade 3 Math MAP score is at or above the national mean: 190 in fall, 195 in winter, and 199 in spring. Scores above the 75th percentile correspond to approximately 201 in fall and 210 in spring, while the 90th percentile sits around 215. Typical annual Math growth in Grade 3 is around 11 RIT points — a natural slowdown from the rapid gains of early elementary years.
What is a good MAP score for 3rd grade in Reading?
A good Grade 3 Reading MAP score is at or above the national mean: 185 in fall, 190 in winter, and 194 in spring. Above the 75th percentile corresponds to approximately 198 in fall and 207 in spring, while the 90th percentile sits around 210. Annual Reading growth in Grade 3 averages around 9 RIT points — reflecting the shift from decoding-focused to meaning-focused reading.
What is a good MAP score for 4th grade?
For Grade 4, the national average is approximately 201 in Math and 196 in Reading in the fall, rising to 209 in Math and 202 in Reading by spring. Scores above the 75th percentile — roughly 217+ in Math and 214+ in Reading by spring — reflect strong fourth-grade performance. Grade 4 is when academic gaps often become more visible, so consistent growth at or above the 50th CGP is particularly valuable.
What is a good MAP score for 4th grade in Math?
A good Grade 4 Math MAP score is at or above the national mean: 201 in fall, 206 in winter, and 209 in spring. The 75th percentile corresponds to approximately 213 in fall and 220 in spring, while the 90th percentile sits around 223. Typical annual Math growth in Grade 4 is around 9 RIT points as students move deeper into multiplication, division, and fractions.
What is a good MAP score for 4th grade in Reading?
A good Grade 4 Reading MAP score is at or above the national mean: 196 in fall, 199 in winter, and 202 in spring. The 75th percentile corresponds to approximately 207 in fall and 214 in spring, while the 90th percentile sits around 216. Annual Reading growth in Grade 4 averages around 6 RIT points — smaller gains are normal as reading comprehension becomes more nuanced and text complexity increases.
What is a good MAP score for 5th grade?
For Grade 5, the national average is approximately 211 in Math and 204 in Reading in the fall, rising to 218 in Math and 208 in Reading by spring. Scores above the 75th percentile — roughly 226+ in Math and 219+ in Reading by spring — indicate strong fifth-grade performance. Grade 5 is typically the final year before the transition to middle school math structures, making a strong Math foundation especially important.
What is a good MAP score for 5th grade in Math?
A good Grade 5 Math MAP score is at or above the national mean: 211 in fall, 215 in winter, and 218 in spring. The 75th percentile corresponds to approximately 222 in fall and 228 in spring, while the 90th percentile sits around 232. Typical annual Math growth in Grade 5 is around 8 RIT points as students consolidate operations with fractions, decimals, and early algebraic thinking.
What is a good MAP score for 5th grade in Reading?
A good Grade 5 Reading MAP score is at or above the national mean: 204 in fall, 206 in winter, and 208 in spring. The 75th percentile corresponds to approximately 214 in fall and 219 in spring, while the 90th percentile sits around 220. Annual Reading growth in Grade 5 averages around 5 RIT points — the pace continues to slow naturally as students become more sophisticated readers engaging with complex nonfiction and literary texts.
What is a good MAP score for 6th grade?
For Grade 6, the national average is approximately 218 in Math and 209 in Reading in the fall, rising to 223 in Math and 212 in Reading by spring. Scores above the 75th percentile — roughly 232+ in Math and 222+ in Reading by spring — indicate strong performance at the start of middle school. Grade 6 marks the beginning of more abstract mathematical thinking, so a strong Math foundation entering this year is especially valuable.
What is a good MAP score for 6th grade in Math?
A good Grade 6 Math MAP score is at or above the national mean: 218 in fall, 221 in winter, and 223 in spring. The 75th percentile corresponds to approximately 229 in fall and 233 in spring, while the 90th percentile sits around 238. Typical annual Math growth in Grade 6 is around 7 RIT points as students transition into ratios, proportional relationships, and the foundations of algebra.
What is a good MAP score for 6th grade in Reading?
A good Grade 6 Reading MAP score is at or above the national mean: 209 in fall, 211 in winter, and 212 in spring. The 75th percentile corresponds to approximately 219 in fall and 222 in spring, while the 90th percentile sits around 224. Annual Reading growth in Grade 6 averages around 3 RIT points — small gains are entirely normal and expected as reading development matures and MAP’s sensitivity to upper-level reading skills naturally decreases.
What is a good MAP score for 7th grade?
For Grade 7, the national average is approximately 222 in Math and 212 in Reading in the fall, rising to 227 in Math and 215 in Reading by spring. Scores above the 75th percentile — roughly 237+ in Math and 225+ in Reading by spring — reflect strong seventh-grade performance. At this level, the gap between students on grade-level and advanced math tracks often begins to widen, so growth percentile is an especially useful number to watch.
What is a good MAP score for 7th grade in Math?
A good Grade 7 Math MAP score is at or above the national mean: 222 in fall, 225 in winter, and 227 in spring. The 75th percentile corresponds to approximately 233 in fall and 237 in spring, while the 90th percentile sits around 242 and the 95th around 250. Typical annual Math growth in Grade 7 is around 6 RIT points — meaningful progress at a stage where many students are working through pre-algebra or early algebra coursework.
What is a good MAP score for 7th grade in Reading?
A good Grade 7 Reading MAP score is at or above the national mean: 212 in fall, 214 in winter, and 215 in spring. The 75th percentile corresponds to approximately 222 in fall and 225 in spring, while the 90th percentile sits around 227 and the 95th around 233. Annual Reading growth in Grade 7 averages around 2 RIT points — this near-plateau is normal and does not reflect a lack of academic progress, simply the limits of what MAP measures at advanced reading levels.
What is a good MAP score for 8th grade?
For Grade 8, the national average is approximately 225 in Math and 216 in Reading in the fall, rising to 229 in Math and 218 in Reading by spring. Scores above the 75th percentile — roughly 240+ in Math and 228+ in Reading by spring — indicate strong eighth-grade performance. Grade 8 is a critical year for Math in particular, as students in algebra-based tracks can score significantly above grade-level norms.
What is a good MAP score for 8th grade in Math?
A good Grade 8 Math MAP score is at or above the national mean: 225 in fall, 227 in winter, and 229 in spring. The 75th percentile corresponds to approximately 237 in fall and 240 in spring, while the 90th percentile sits around 245 and the 95th around 254. Students enrolled in Algebra I or Geometry in Grade 8 often score well above these norms, reflecting the advanced coursework. Typical annual growth at this stage is around 5 RIT points.
What is a good MAP score for 8th grade in Reading?
A good Grade 8 Reading MAP score is at or above the national mean: 216 in fall, 217 in winter, and 218 in spring. The 75th percentile corresponds to approximately 226 in fall and 228 in spring, while the 90th percentile sits around 229 and the 95th around 235. Annual Reading growth in Grade 8 averages just 2 RIT points — a near-plateau that is entirely expected and normal at this level.
What is a good MAP score for 9th grade?
For Grade 9, the national average is approximately 226 in Math and 216 in Reading in the fall. Scores above the 75th percentile — roughly 242+ in Math and 228+ in Reading — reflect strong high school performance. By Grade 9, MAP scores begin to plateau for most students, especially in Reading; small gains or stable scores do not indicate stagnation but rather the natural ceiling of what MAP is designed to measure at advanced academic levels.
What is a good MAP score for 9th grade in Math?
A good Grade 9 Math MAP score is at or above the national mean of approximately 226 in fall, 228 in winter, and 230 in spring. The 75th percentile corresponds to roughly 241 in fall, while the 90th percentile sits around 247. Students in advanced math courses such as Algebra II or Pre-Calculus in Grade 9 often score well above these averages. Typical annual Math growth at this stage is around 4 RIT points.
What is a good MAP score for 9th grade in Reading?
A good Grade 9 Reading MAP score is at or above the national mean of approximately 216 in fall and 217 in spring. The 75th percentile corresponds to roughly 228 in fall, while the 90th percentile sits around 232. Annual Reading growth in Grade 9 averages just 1 RIT point — a near-plateau that is expected. A stable high score is a positive indicator; the key is that the score does not decline.
What is a good MAP score for 10th grade?
For Grade 10, the national average is approximately 229 in Math and 218 in Reading in the fall. Scores above the 75th percentile — roughly 244+ in Math and 228+ in Reading — reflect strong performance at this level. Reading scores plateau for most students at Grade 10, while Math scores continue to reflect the diversity of course tracks, with students in advanced courses often scoring significantly above the national mean.
What is a good MAP score for 10th grade in Math?
A good Grade 10 Math MAP score is at or above the national mean of approximately 229 in fall, 231 in winter, and 232 in spring. The 75th percentile corresponds to roughly 244 in fall, while the 90th percentile sits around 249. Students in advanced courses such as Algebra II, Pre-Calculus, or Statistics often score considerably above these norms. Typical annual growth at this stage is around 4 RIT points.
What is a good MAP score for 10th grade in Reading?
A good Grade 10 Reading MAP score is at or above the national mean of approximately 218 across all three seasons — fall, winter, and spring scores are essentially flat at this level. The 75th percentile corresponds to roughly 228, while the 90th percentile sits around 232. A stable score in the 218–230 range is entirely normal and healthy in Grade 10; the RIT scale simply does not capture the full complexity of high school-level reading comprehension.
What is a good MAP score for 11th grade?
For Grade 11, the national average is approximately 231 in Math and 218 in Reading in the fall. Scores above the 75th percentile — roughly 246+ in Math and 228+ in Reading — reflect strong performance. By Grade 11, Reading norms are fully plateaued at the national mean level, and even strong readers may see little movement. Math remains the more differentiating subject, with course-track differences producing wider score ranges among students.
What is a good MAP score for 11th grade in Math?
A good Grade 11 Math MAP score is at or above the national mean of approximately 231 in fall, 233 in winter, and 234 in spring. The 75th percentile corresponds to roughly 246 in fall, while the 90th percentile sits around 251. Students in AP Calculus or Statistics in Grade 11 frequently score above 250 or higher. Typical annual growth at this stage is just 3 RIT points, as the scale naturally compresses at higher levels.
What is a good MAP score for 11th grade in Reading?
A good Grade 11 Reading MAP score is at or above the national mean of approximately 218, which is flat across all three seasons at this level. The 75th percentile corresponds to roughly 228, while the 90th percentile sits around 232. A score of 218 or above in Grade 11 Reading is on track nationally; scores above 228 are strong. The absence of RIT growth in Reading at this level is expected and does not reflect declining academic performance.
What is a good MAP score for 12th grade?
For Grade 12, the national average is approximately 232 in Math and 218 in Reading in the fall. Scores above the 75th percentile — roughly 248+ in Math and 228+ in Reading — reflect strong senior-year performance. Grade 12 is the final year MAP Growth is administered in most schools, and a slight dip in Reading norms at this level (to 216 by spring) is a normal artefact of the testing population rather than a sign of academic decline.
What is a good MAP score for 12th grade in Math?
A good Grade 12 Math MAP score is at or above the national mean of approximately 232 in fall, 233 in winter, and 234 in spring. The 75th percentile corresponds to roughly 248 in fall, while the 90th percentile sits around 254 or higher. Students completing AP Calculus or other advanced mathematics in Grade 12 routinely score well above these averages. Typical annual growth at this stage is just 2 RIT points.
What is a good MAP score for 12th grade in Reading?
A good Grade 12 Reading MAP score is at or above the national mean of approximately 218 in fall and 216 in spring. The 75th percentile corresponds to roughly 228 in fall, while the 90th percentile sits around 232. The slight downward drift in spring norms at Grade 12 reflects changes in who is tested at this stage rather than a genuine national decline in reading ability. A score of 218 or above is solidly on track; anything above 228 is strong.
What is the difference between MAP Math and MAP Reading scores?
MAP Math and MAP Reading are scored on the same RIT scale, but the scores are not interchangeable or directly comparable. A Math RIT of 220 and a Reading RIT of 220 do not represent the same level of achievement — they are separate scales for separate subjects, each with their own national norms by grade and season. Always compare a subject score against the norms for that specific subject, never across subjects.
What does it mean if my child’s MAP score went down?
A single score decline is not automatically alarming. A small drop from spring to fall is common and is called the summer slide — most students lose a few points over the summer. A decline during the school year (fall to winter, or winter to spring) is worth a conversation with the teacher, particularly if it happens across two or more terms. One dip caused by illness, anxiety, or rapid guessing on test day does not define a trend.
How do MAP scores relate to state standardised test scores?
MAP Growth reports often include projections for how a student is likely to perform on their state’s standardised assessment (such as the SBAC, PARCC, or state-specific tests), based on their current RIT score and growth trajectory. These projections are estimates, not guarantees, but they are reasonably accurate when a student tests under normal conditions. Strong MAP performance generally correlates with strong state test performance.
Can a student be above average in growth but below average in achievement?
Yes — and this is one of the most important patterns MAP can reveal. A student at the 30th percentile in achievement but the 75th in growth is learning at a faster rate than most of their peers who started at the same level, and is actively closing the gap. This student deserves encouragement and continued support, not a deficit-focused conversation. The growth percentile is in many ways a more meaningful indicator than the achievement percentile alone.
What is a goal area on the MAP report?
Goal areas are the subject sub-strands that MAP reports break each subject into — for example, Math goal areas might include Operations & Algebraic Thinking, Number & Operations in Base Ten, and Geometry. Each goal area is scored on a Low / Low Average / Average / High Average / High descriptor scale, showing where a student’s skills are strongest and where they need the most support. Goal areas are most visible on the Student Profile Report that teachers receive.
How accurate are MAP test scores?
MAP Growth is one of the most statistically reliable large-scale assessments in K–12 education, built on a rigorous psychometric model called Item Response Theory. Each RIT score comes with a standard error of measurement, which means individual scores are best understood as a range rather than a single precise number — typically plus or minus 3 RIT points. Across multiple test events over time, patterns in the data become increasingly reliable and meaningful.
Do MAP scores predict future academic success?
Research consistently shows that MAP growth trajectories are moderately to strongly predictive of later academic outcomes, including state test performance, high school course readiness, and college preparedness indicators. Students who demonstrate consistently strong growth in early elementary grades — regardless of their starting achievement level — tend to show stronger long-term outcomes than students whose early growth is flat even if their starting scores are high.
What should I do if I think my child’s MAP score is wrong?
If a MAP score seems inconsistent with your child’s classroom performance, the first step is to speak with their teacher and ask whether the result aligns with what they observe day-to-day. Check whether there were any unusual circumstances on test day — illness, disruption, or rapid guessing can all depress scores. If the mismatch is significant, ask whether a retest is appropriate. A single unusual score is not a reliable basis for major academic decisions.
Please, visit the complete NWEA Map Score FAQ, here.
All grade-level RIT benchmarks referenced in this FAQ are based on 2025 NWEA MAP Growth norms. Percentile-to-RIT mappings are approximations derived from national student-level norm distributions. Individual results vary. For precise percentile tables, consult the official NWEA documentation at nwea.org.