
What Is a Good SAT Score? Good, Average & High Score Range Charts 2026-2027
Looking for a straight answer on what is a good SAT score for 2026-2027? We have added the exact SAT score ranges, current averages, full percentile tables and charts, a breakdown of whether specific scores like 1200, 1250, or 1400 are good, what colleges actually require.
Also, we have added a very interesting SAT scores break down by state, race, and gender. Just the numbers and what they actually mean for you.
What Is a Good SAT Score?
A good SAT score is generally considered anything at or above 1200, which places you above roughly three-quarters of recent test takers. But “good” isn’t a single number, it depends on which percentile scale you’re looking at, your target schools, and how your section scores split between Reading & Writing and Math. This section breaks down all of it.
Full SAT Score Percentile Chart
| Total Score | User Percentile (approx.) | Nationally Representative (approx.) | Tier |
|---|---|---|---|
| 1600 | 99+ | 99+ | Perfect Score |
| 1550 | ~99 | 99+ | Elite |
| 1500 | ~97 | ~99 | Elite |
| 1450 | ~95 | ~98 | Top 10% |
| 1400 | ~93 | ~97 | Top 10% |
| 1350 | ~90 | ~96 | Top 10% |
| 1300 | ~87 | ~94 | Competitive |
| 1250 | ~82 | ~91 | Competitive |
| 1200 | ~75 | ~81 | Competitive |
| 1150 | ~68 | ~76 | Above Average |
| 1100 | ~60 | ~68 | Above Average |
| 1050 | ~51 | ~58 | Above Average |
| 1000 | ~43 | ~50 | Below Average |
| 950 | ~35 | ~41 | Below Average |
| 900 | ~27 | ~33 | Below Average |
| 850 | ~20 | ~25 | Below Average |
| 800 | ~14 | ~18 | Below Average |
Percentiles are approximate, compiled from College Board’s published percentile methodology, and shift slightly year to year. For your exact current-year percentile, check your official score report or College Board’s own percentile tables.
User Percentile vs. Nationally Representative Percentile
This is the single biggest reason you’ll see different sites report different percentiles for the same score, and it’s worth understanding before you look at any table, including the one below. College Board actually publishes two separate percentile scales on every score report:
- SAT User Percentile compares you only against students who actually took the SAT in the past few years. This is the number most relevant to college admissions, since it reflects your standing among your real competition.
- Nationally Representative Percentile compares you against a broader research sample of all U.S. 11th and 12th graders, including students who never took the SAT at all. Because that broader group includes many students who wouldn’t score as high, the same score looks higher on this scale than on the User Percentile scale.
For college planning purposes, the User Percentile is almost always the more useful number, since it tells you where you stand against the students colleges are actually comparing you to.
Score Distribution: How Rare Is a High Score?
Roughly 2 million students take the SAT each year, and the scores cluster much more tightly than most people expect. The national average sits at 1029. Only around 7% of all test takers score in the 1400-1600 range, which is exactly why a 1400+ score carries real weight on an application, it genuinely puts you in a small minority.
SAT Score to Percentile Chart

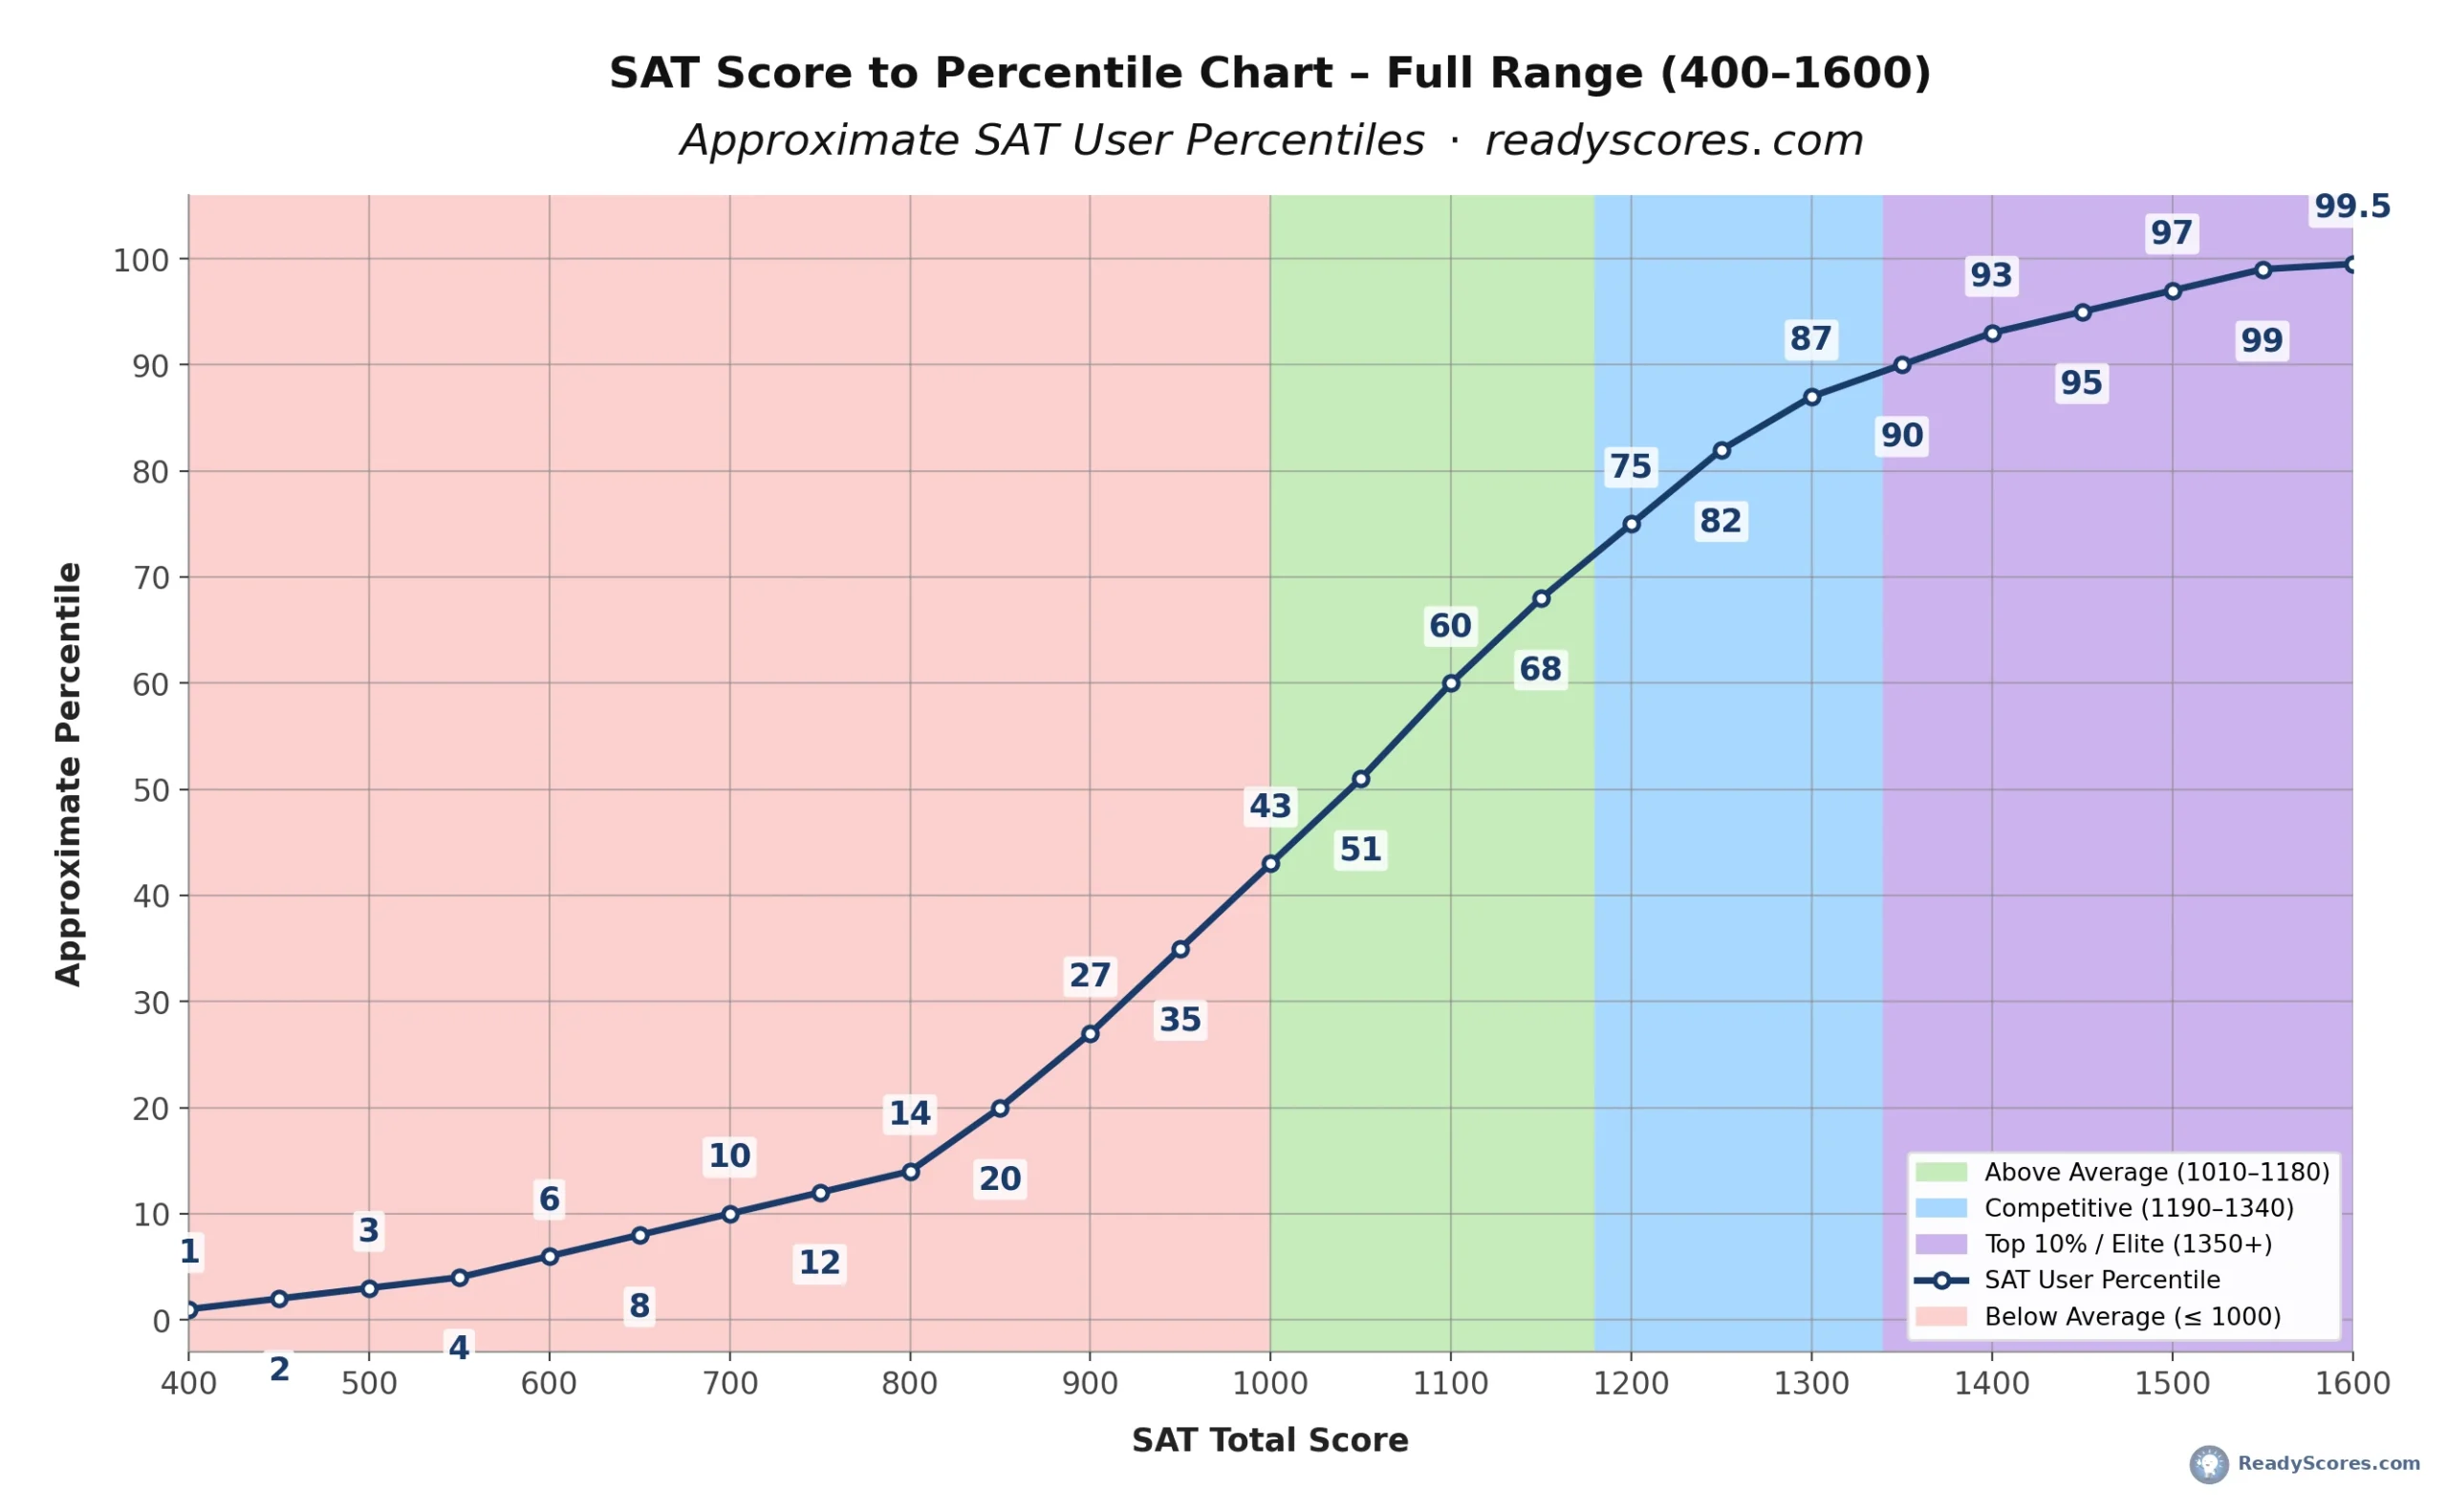
Find your score along the bottom axis and trace straight up to see your approximate percentile. Notice how steep the curve is between 900 and 1300, that’s where most test takers cluster, so small score gains move you through many percentile points fast. Above 1450, the curve flattens sharply since so few students score that high, meaning the same point gain buys you much less percentile movement at the top end.
SAT Score Distribution Bell Curve

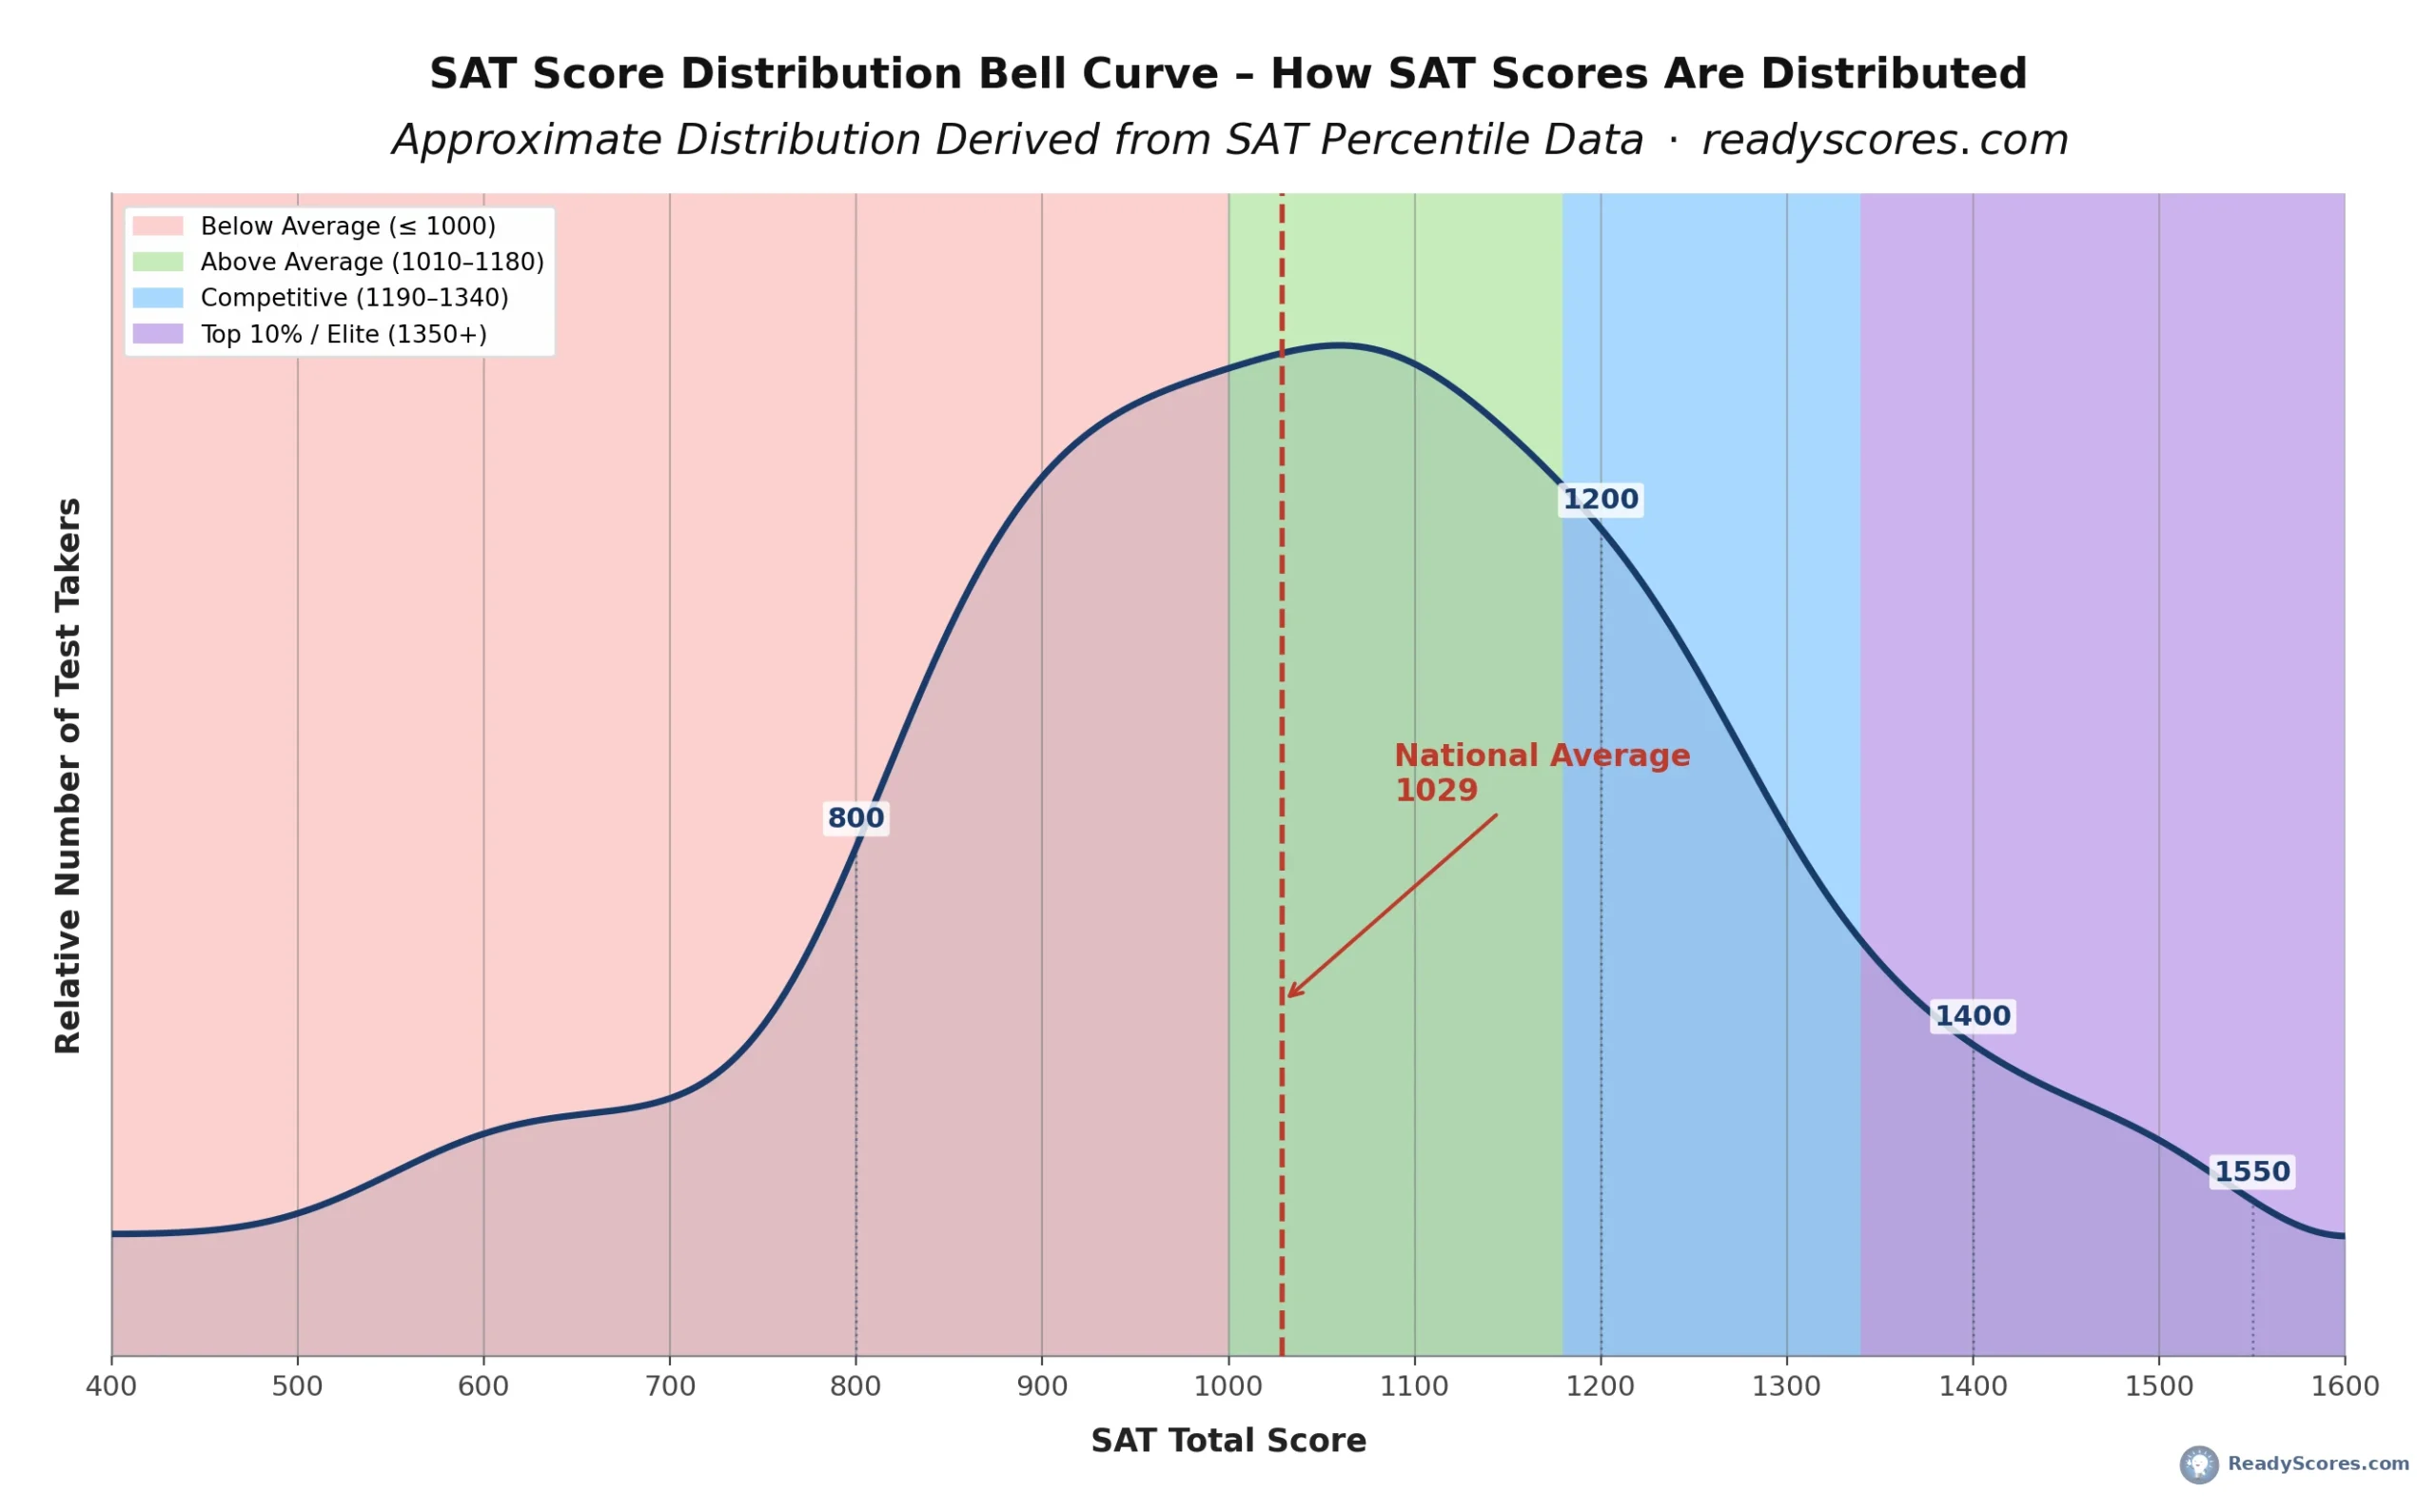
This chart shows how test takers actually spread out across the score range, rather than just the cumulative percentile. The peak sits right around the national average of 1029, meaning most students cluster within a few hundred points of that number. Notice how thin the curve gets out past 1400, that’s the visual version of the “only about 7% of students score 1400+” statistic mentioned earlier: there simply aren’t many test takers out in that territory, which is exactly why a high score carries so much weight.
Every SAT Percentile: 99th Through 1st, With Score and Tier
This table shows the approximate score for every single percentile from 99th down to 1st, along with which tier it falls into. Use it to find your exact percentile rank, or to see precisely how much score improvement it takes to climb from one percentile to the next.
| Percentile | Approx. Score | Tier |
|---|---|---|
| 99th | 1550 | ⬤ Elite |
| 98th | 1520 | ⬤ Top 10% |
| 97th | 1500 | ⬤ Top 10% |
| 96th | 1480 | ⬤ Top 10% |
| 95th | 1450 | ⬤ Top 10% |
| 94th | 1420 | ⬤ Top 10% |
| 93rd | 1400 | ⬤ Top 10% |
| 92nd | 1380 | ⬤ Top 10% |
| 91st | 1370 | ⬤ Top 10% |
| 90th | 1350 | ⬤ Top 10% |
| 89th | 1330 | ⬤ Competitive |
| 88th | 1320 | ⬤ Competitive |
| 87th | 1300 | ⬤ Competitive |
| 86th | 1290 | ⬤ Competitive |
| 85th | 1280 | ⬤ Competitive |
| 84th | 1270 | ⬤ Competitive |
| 83rd | 1260 | ⬤ Competitive |
| 82nd | 1250 | ⬤ Competitive |
| 81st | 1240 | ⬤ Competitive |
| 80th | 1240 | ⬤ Competitive |
| 79th | 1230 | ⬤ Competitive |
| 78th | 1220 | ⬤ Competitive |
| 77th | 1210 | ⬤ Competitive |
| 76th | 1210 | ⬤ Competitive |
| 75th | 1200 | ⬤ Competitive |
| 74th | 1190 | ⬤ Competitive |
| 73rd | 1190 | ⬤ Competitive |
| 72nd | 1180 | ⬤ Above Average |
| 71st | 1170 | ⬤ Above Average |
| 70th | 1160 | ⬤ Above Average |
| 69th | 1160 | ⬤ Above Average |
| 68th | 1150 | ⬤ Above Average |
| 67th | 1140 | ⬤ Above Average |
| 66th | 1140 | ⬤ Above Average |
| 65th | 1130 | ⬤ Above Average |
| 64th | 1120 | ⬤ Above Average |
| 63rd | 1120 | ⬤ Above Average |
| 62nd | 1110 | ⬤ Above Average |
| 61st | 1110 | ⬤ Above Average |
| 60th | 1100 | ⬤ Above Average |
| 59th | 1090 | ⬤ Above Average |
| 58th | 1090 | ⬤ Above Average |
| 57th | 1080 | ⬤ Above Average |
| 56th | 1080 | ⬤ Above Average |
| 55th | 1070 | ⬤ Above Average |
| 54th | 1070 | ⬤ Above Average |
| 53rd | 1060 | ⬤ Above Average |
| 52nd | 1060 | ⬤ Above Average |
| 51st | 1050 | ⬤ Above Average |
| 50th | 1040 | ⬤ Above Average |
| 49th | 1040 | ⬤ Above Average |
| 48th | 1030 | ⬤ Above Average |
| 47th | 1020 | ⬤ Above Average |
| 46th | 1020 | ⬤ Above Average |
| 45th | 1010 | ⬤ Above Average |
| 44th | 1010 | ⬤ Above Average |
| 43rd | 1000 | ⬤ Below Average |
| 42nd | 990 | ⬤ Below Average |
| 41st | 990 | ⬤ Below Average |
| 40th | 980 | ⬤ Below Average |
| 39th | 980 | ⬤ Below Average |
| 38th | 970 | ⬤ Below Average |
| 37th | 960 | ⬤ Below Average |
| 36th | 960 | ⬤ Below Average |
| 35th | 950 | ⬤ Below Average |
| 34th | 940 | ⬤ Below Average |
| 33rd | 940 | ⬤ Below Average |
| 32nd | 930 | ⬤ Below Average |
| 31st | 920 | ⬤ Below Average |
| 30th | 920 | ⬤ Below Average |
| 29th | 910 | ⬤ Below Average |
| 28th | 910 | ⬤ Below Average |
| 27th | 900 | ⬤ Below Average |
| 26th | 890 | ⬤ Below Average |
| 25th | 890 | ⬤ Below Average |
| 24th | 880 | ⬤ Below Average |
| 23rd | 870 | ⬤ Below Average |
| 22nd | 860 | ⬤ Below Average |
| 21st | 860 | ⬤ Below Average |
| 20th | 850 | ⬤ Below Average |
| 19th | 840 | ⬤ Below Average |
| 18th | 830 | ⬤ Below Average |
| 17th | 820 | ⬤ Below Average |
| 16th | 820 | ⬤ Below Average |
| 15th | 810 | ⬤ Below Average |
| 14th | 800 | ⬤ Below Average |
| 13th | 780 | ⬤ Below Average |
| 12th | 750 | ⬤ Below Average |
| 11th | 720 | ⬤ Below Average |
| 10th | 700 | ⬤ Below Average |
| 9th | 680 | ⬤ Below Average |
| 8th | 650 | ⬤ Below Average |
| 7th | 620 | ⬤ Below Average |
| 6th | 600 | ⬤ Below Average |
| 5th | 580 | ⬤ Below Average |
| 4th | 550 | ⬤ Below Average |
| 3rd | 500 | ⬤ Below Average |
| 2nd | 450 | ⬤ Below Average |
| 1st | 400 | ⬤ Below Average |
Scores are approximate, rounded to the nearest 10, and interpolated from College Board’s published percentile data. Actual current-year percentiles may vary slightly; check your official score report for your exact figure.
Section Score Tiers: Reading & Writing vs. Math
| Tier | Total Score | Reading & Writing | Math |
|---|---|---|---|
| Below Average | 1000 or lower | 510 or lower | 490 or lower |
| Above Average | 1010–1180 | 520–600 | 500–580 |
| Competitive | 1190–1340 | 610–670 | 590–680 |
| Best / Top 10% | 1350–1600 | 680–800 | 690–800 |
Your total score can hide an imbalance between sections. A 1300 built from a 700 Math and 600 Reading & Writing tells a different story to admissions officers than a 1300 split evenly at 650/650, especially for STEM-heavy programs that weight the Math section more heavily in their own internal review. Check both section scores against the tiers above, not just your total.
SAT Scores by Race, Gender, State, and Family Income
Beyond the basic average, SAT scores break down in some genuinely interesting ways once you slice the data by demographic group, geography, and family background. Some of these patterns have obvious explanations. Others, like why a handful of states post scores 200+ points above the national average, come down to something most people wouldn’t guess.
Average SAT Scores by Race and Ethnicity
The federal government’s National Center for Education Statistics publishes average SAT scores broken down by demographic group. It’s important to read this data with context: these gaps are well documented in education research as reflecting disparities in school funding, access to test preparation, and other structural and socioeconomic factors, not differences in innate ability, a point reinforced by the income data further down this section.
| Group | Total Score | Reading & Writing | Math |
|---|---|---|---|
| All Students | 1028 | 520 | 508 |
| Asian | 1219 | 593 | 626 |
| Two or More Races | 1091 | 556 | 535 |
| White | 1082 | 550 | 532 |
| Hispanic | 943 | 482 | 461 |
| Pacific Islander | 925 | 473 | 452 |
| Black | 908 | 466 | 441 |
| American Indian/Alaska Native | 901 | 458 | 443 |
Source: National Center for Education Statistics, Digest of Education Statistics, Table 226.10 (most recent year available: 2023 high school seniors).
Average SAT Scores by Gender
Male and female test takers show a consistent, if modest, gap that’s held steady for years. Recent College Board data (class of 2024) shows male students outscoring female students by roughly 11 points on the total score, driven almost entirely by the Math section, where males average around 20 points higher. Female students actually score slightly higher on Reading & Writing. The gap widens considerably at the top end: among students scoring 1400 or above, a clear majority are male.
| Group | Total Score (approx.) | Reading & Writing | Math |
|---|---|---|---|
| Male | ~1034 | ~518 | ~516 |
| Female | ~1023 | ~520 | ~496 |
Source: College Board class of 2024 data as compiled and reported by BestColleges. Figures are approximate national averages.
One trend worth watching: students who identify their gender as something other than male or female have shown notably strong recent performance, ranking as the highest-scoring gender group in 2022, 2023, and 2024, though this is a much smaller population than the male and female test-taking groups.
Average SAT Scores by State: Full Ranking, Highest to Lowest
This is the data point most people get wrong at first glance. The states with the highest average SAT scores aren’t the states with the best schools, they’re the states where almost nobody takes the SAT. When only 1-2% of students in a state take the test, it’s typically a small, highly self-selected group of top students aiming for competitive out-of-state colleges, which pulls that state’s average way up. States that require every student to take the SAT get a true cross-section of their student population, which produces a lower but far more representative average.
Watch the participation column as you scroll down this table. It moves in almost the exact opposite direction of the score column, and that relationship is the real story here, not the ranking itself.
| Rank | State | Average SAT | Participation |
|---|---|---|---|
| 1 | North Dakota | 1254 | 1% |
| 2 | Nebraska | 1249 | 1% |
| 3 | Wisconsin | 1240 | 2% |
| 4 | Kansas | 1238 | 2% |
| 5 | Wyoming | 1234 | 1% |
| 6 | Utah | 1229 | 2% |
| 7 | Mississippi | 1223 | 1% |
| 8 | South Dakota | 1214 | 2% |
| 9 | Iowa | 1211 | 2% |
| 10 | Minnesota | 1210 | 3% |
| 11 | Montana | 1205 | 5% |
| 12 | Louisiana | 1195 | 2% |
| 13 | Arizona | 1194 | 10% |
| 14 | Tennessee | 1189 | 4% |
| 15 | Kentucky | 1181 | 2% |
| 16 | Arkansas | 1177 | 2% |
| 16 | Nevada | 1177 | 7% |
| 18 | Missouri | 1174 | 4% |
| 19 | Alabama | 1172 | 3% |
| 20 | North Carolina | 1165 | 22% |
| 21 | Oklahoma | 1150 | 2% |
| 22 | Oregon | 1127 | 24% |
| 23 | Hawaii | 1125 | 29% |
| 24 | Vermont | 1115 | 49% |
| 25 | Massachusetts | 1114 | 57% |
| 26 | Virginia | 1112 | 48% |
| 27 | Alaska | 1097 | 27% |
| 28 | California | 1096 | 26% |
| 29 | Washington | 1095 | 35% |
| 30 | Pennsylvania | 1084 | 47% |
| 31 | Maine | 1078 | 39% |
| 32 | New Jersey | 1061 | 66% |
| 33 | New York | 1045 | 62% |
| 34 | Georgia | 1038 | 56% |
| — | National Average | 1029 | — |
| 35 | Ohio | 1018 | 20% |
| 36 | South Carolina | 1017 | 53% |
| 36 | New Hampshire | 1017 | 76% |
| 38 | Idaho | 1003 | 69% |
| 38 | Maryland | 1003 | 73% |
| 40 | Connecticut | 989 | 91% |
| 41 | Colorado | 987 | 90% |
| 42 | Florida | 970 | 87% |
| 43 | Texas | 964 | 74% |
| 44 | Illinois | 961 | 99% |
| 45 | Michigan | 953 | 100% |
| 46 | Indiana | 950 | 100% |
| 47 | Rhode Island | 935 | 99% |
| 48 | Delaware | 933 | 94% |
| 49 | West Virginia | 911 | 93% |
| 50 | New Mexico | 875 | 100% |
Source: College Board 2025 SAT Suite of Assessments Annual Report (Class of 2025 data). Washington, D.C. is reported separately by College Board and not included in this state ranking. Rankings can shift slightly year to year as new annual reports are released.
One state is worth a special note: Illinois shows 99% participation and a below-average score in this table because it tested nearly every junior on the SAT through the class of 2025, but it switched its statewide exam to the ACT starting with the 2024-2025 school year. Its high-participation SAT numbers won’t continue in future reporting.
The takeaway: never compare your score directly to a state average without checking that state’s participation rate first. A 1029 in a 100%-participation state is a genuinely average score. A 1029 in a 1%-participation state means you scored below a small, elite self-selected group, which is a very different thing. Colleges compare your score against national percentiles and their own applicant pool, not against your state’s average, so use your state’s number for context and curiosity, not as your actual target.
SAT Scores by Family Income
This is probably the single most striking data point on this page. Economists at Opportunity Insights matched SAT and ACT scores to actual federal tax records of test takers’ parents, and found that roughly one-third of students from top-income families scored 1300 or above, compared to less than 5% of students from middle-class families. That’s not a small gap, it’s nearly a 7x difference in the rate of reaching a highly competitive score.
Researchers generally treat family income as a stand-in for a bundle of advantages rather than a direct cause on its own: money for test prep and tutoring, better-funded schools, stable housing, and parental time available to support studying. Some research has found that parental education level tracks even more closely with SAT performance than income alone, since the two are deeply intertwined. Either way, the pattern is consistent and well documented: SAT scores correlate strongly with family socioeconomic background, which is exactly why so many colleges now weigh test scores alongside, rather than instead of, the rest of a student’s context.
Source: Opportunity Insights research matching SAT/ACT scores to federal tax records, as reported by The New York Times and The Daily Pennsylvanian.
The Fastest Percentile Gains Aren’t Where You’d Expect
Score gains translate into percentile jumps very unevenly. Between roughly 1200 and 1400, every 50-point improvement moves you up about 8 to 10 percentile points, since that’s where the bulk of test takers are clustered. Above about 1450, the curve flattens sharply, and the same 50-point gain only moves you 3 to 4 percentile points, since so few students score that high to begin with. Practically, this means the jump from 1250 to 1350 is far more valuable percentile-wise than the jump from 1500 to 1550, even though both are 100-point improvements.
What Is the Average SAT Score?
The average SAT score is 1028 out of 1600, based on the most recent official national data. That splits into an average of 520 on Reading and Writing and 508 on Math. If your score is above 1028, you’re already scoring above the typical American high school senior who takes the test, though “average” and “good enough for your target school” are two very different bars, especially for selective colleges.
SAT Score Range Explained
The SAT total score ranges from 400 to 1600. That total is made up of two section scores, each ranging from 200 to 800: Evidence-Based Reading and Writing, and Math. There’s no separate “essay score” anymore since the optional essay was discontinued. Every score you’ll ever see, on a report, on a college’s admitted-student profile, or in casual conversation, is either the 400-1600 total or one of the two 200-800 section scores.
Digital SAT Scoring Explained
The SAT is now fully digital and adaptive, which changes how your score gets built compared to the old paper test. Each section (Reading and Writing, then Math) is split into two modules. How you perform on the first module determines the difficulty of the second module you’re given. Do well on module one, and module two routes you to harder questions with a higher score ceiling. Struggle on module one, and module two will be easier, but it also caps how high your final section score can go.
There’s no real strategic advantage in trying to figure out which module you were routed to mid-test. Your job on every single question is the same regardless: answer it as well as you can. The adaptive system is designed to pinpoint your ability level precisely, not to trick you, and both the easier and harder second-module paths have overlapping possible final scores.
Is a [Specific Score] a Good SAT Score?
Here’s a direct answer for exactly where your specific score stands, since “is 1250 a good SAT score” and similar score-specific questions are some of the most common searches on this topic.
Is 900 a good SAT score?
No, 900 is below the national average of 1028 and falls in the below-average tier. It corresponds to roughly an ACT equivalent of 16. It’s not a disqualifying score everywhere, especially for open-enrollment or less selective schools, but it will limit your options at most four-year colleges.
Is 1000 a good SAT score?
1000 sits just below the national average of 1028, right at the edge between the below-average and above-average tiers. It’s a workable score for many state schools and less selective private colleges, but it’s below the range most selective schools publish for their admitted students.
Is 1100 a good SAT score?
Yes, 1100 is above the national average and sits solidly in the above-average tier, roughly the 55th to 60th percentile. It’s a reasonable score for a wide range of four-year colleges, though it’s still well below the range typically published by selective and highly selective schools.
Is 1200 a good SAT score?
Yes, 1200 is generally considered a good SAT score, sitting right at the boundary of the competitive tier, roughly the 74th percentile. It’s a strong score for most public universities and many private colleges, though it typically falls below the middle 50% range at the most selective schools.
Is 1230 a good SAT score?
Yes, 1230 is a good score, landing in the competitive tier around the 77th percentile. It converts to roughly a 26 on the ACT scale, and it’s a strong number for the large majority of four-year colleges and universities in the U.S.
Is 1250 a good SAT score?
Yes, 1250 is a good SAT score, sitting comfortably in the competitive tier around the 78th to 79th percentile. It’s equivalent to roughly a 26 on the ACT. This score works well for most state flagship universities and a wide range of private colleges, though highly selective schools generally want to see higher.
Is 1270 a good SAT score?
Yes, 1270 is a good score, landing around the 80th percentile nationally, roughly equivalent to a 27 on the ACT. It’s competitive at most public and private universities, sitting close to or within the lower end of the admitted range at several selective schools.
Is 1300 a good SAT score?
Yes, 1300 is a strong score, sitting around the 84th to 85th percentile and equivalent to roughly a 28 on the ACT. It’s within or close to the admitted range at many well-regarded universities, though it typically remains below the range for Ivy League and other highly selective schools.
Is 1350 a good SAT score?
Yes, 1350 is an excellent score, marking the entry point to the top 10% of all test takers nationally, roughly equivalent to a 29 on the ACT. This is the score level where you become genuinely competitive at a wide range of selective universities, though it’s still generally below the middle range at the most selective Ivy League schools.
Is 1400 a good SAT score?
Yes, 1400 is an excellent score, comfortably in the top 10% nationally and equivalent to roughly a 31 on the ACT. It’s within the typical admitted range at many strong national universities, and it’s close to the lower end of the range at several highly selective schools, though generally still below the median for Ivy League admits.
Is 1450 a good SAT score?
Yes, 1450 is an excellent score, equivalent to roughly a 33 on the ACT. It sits within or near the lower end of the middle 50% range at most Ivy League and highly selective schools, meaning it’s a genuinely competitive score at that level, though not one that makes your application stand out on scores alone.
Is 1500 a good SAT score?
Yes, 1500 is an outstanding score, equivalent to roughly a 34 on the ACT and within the middle 50% range at nearly every Ivy League and top national university. At this level, your SAT score is a genuine strength on your application rather than a neutral factor.
Is 1550 a good SAT score?
Yes, 1550 is an exceptional score, equivalent to roughly a 35 on the ACT and at or above the median admitted score at every Ivy League school. This is widely considered the level at which your SAT score stops being something an admissions committee could hold against you, even at the most selective schools.
Is 1600 a good SAT score?
Yes, 1600 is a perfect score, the highest possible on the SAT, equivalent to a 36 on the ACT. Only a very small fraction of test takers achieve it each year. That said, admissions officers at top schools have publicly stated that a perfect score doesn’t guarantee admission, since holistic review weighs many other factors alongside test scores.
Have the Goalposts for a “Good” SAT Score Actually Moved?
This is a genuinely fair question, and a large, active discussion thread on Reddit’s SAT community captures the shift well. The consensus among current applicants and recent test-takers is that expectations at the most selective schools have crept upward compared to a decade or so ago, when scores in the 1490 range were seen as sufficient for top-20 schools. Today, many commenters describe 1520 to 1550 as closer to the level where your score stops being a weak point on an application to the most selective universities.
Two important nuances came up repeatedly in that discussion. First, the widespread shift to test-optional admissions policies means published score ranges at many schools now skew higher than they did when nearly all applicants submitted scores, since students with lower scores are more likely to withhold them. Comparing current test-optional-era ranges directly to pre-2020 ranges can overstate how much the actual bar has risen. Second, several commenters pointed out that admissions offices, including Yale’s, have publicly pushed back on the idea that chasing an ever-higher score is worthwhile past a certain point, noting that applicants often spend disproportionate energy on marginal score gains relative to how much those gains actually influence admissions decisions.
The practical takeaway echoed across the thread: a score in the 1450 to 1500 range is generally still considered solid for most competitive schools, 1520 and up is where your score becomes a genuine asset for the most selective tier, and beyond roughly 1550, further gains matter far less than continuing to strengthen the rest of your application.
SAT Scores Needed for Top Colleges
Below are the typical SAT score ranges (middle 50% of admitted students) and acceptance rates for Ivy League and other highly selective schools. These ranges reflect scores among students who chose to submit them, which may skew slightly higher under current test-optional policies.
Ivy League SAT Scores
| School | Typical SAT Range | Acceptance Rate |
|---|---|---|
| Harvard University | 1510–1580 | ~4% |
| Columbia University | 1510–1560 | ~4% |
| Princeton University | 1470–1560 | ~4% |
| Yale University | 1480–1560 | ~5% |
| University of Pennsylvania | 1510–1570 | ~5% |
| Dartmouth College | 1510–1560 | ~5% |
| Brown University | 1470–1550 | ~6% |
| Cornell University | 1510–1560 | ~8% |
Other Top National Universities
| School | Typical SAT Range |
|---|---|
| Massachusetts Institute of Technology (MIT) | 1520–1570 |
| Duke University | 1520–1570 |
| Johns Hopkins University | 1530–1560 |
| Stanford University | 1510–1570 |
| University of Chicago | 1510–1560 |
| New York University (NYU) | 1480–1550 |
Top Liberal Arts Colleges
| School | Typical SAT Range |
|---|---|
| Williams College | 1500–1560 |
| Amherst College | 1500–1560 |
| Swarthmore College | 1500–1550 |
| Pomona College | 1480–1550 |
| Wellesley College | 1470–1550 |
| Bowdoin College | 1470–1540 |
Sources: College Board BigFuture, U.S. News & World Report. Ranges represent the middle 50% of admitted or enrolled students and are approximate.
Official ACT to SAT Score Conversion Chart
The table below is the official 2018 ACT/College Board concordance table, the most recent one published, showing how SAT total scores compare to ACT composite scores.
| SAT | ACT | SAT | ACT | SAT | ACT |
|---|---|---|---|---|---|
| 1600 | 36 | 1330 | 29 | 1060 | 21 |
| 1560 | 35 | 1300 | 28 | 1030 | 20 |
| 1520 | 34 | 1270 | 27 | 1000 | 19 |
| 1480 | 33 | 1250 | 26 | 960 | 18 |
| 1440 | 32 | 1200 | 25 | 920 | 17 |
| 1400 | 31 | 1170 | 24 | 900 | 16 |
| 1360 | 30 | 1130 | 23 | 860 | 15 |
| 1230 | 26 | 1100 | 22 | 800 | 14 |
Source: ACT/College Board 2018 official concordance study. This is an abbreviated version — see our full SAT/ACT conversion calculator for every score point.
Where to Get Your SAT Scores and How to Send Them to Colleges
Your official SAT scores are only available through the College Board itself, since it’s the organization that administers the test and holds your results. To check your own score, visit the official College Board SAT scores portal. To send your scores to colleges, whether for the first time or as an additional score report, use the College Board’s official score-sending system, which also explains Score Choice and current sending fees.
People Also Ask
Is a 900 a good SAT score?
No, 900 is below the national average of 1028 and falls in the below-average tier, though it may still be workable for open-enrollment or less selective colleges.
Is 1500 SAT good for Harvard?
1500 sits just below Harvard’s typical 1510-1580 range, so it’s a strong but not clearly median score there. It would be considered competitive, especially paired with strong grades and extracurriculars, though it’s toward the lower end of Harvard’s admitted range.
Is a 1200 a good SAT score?
Yes, 1200 is generally considered a good score, sitting around the 74th percentile nationally and strong for most public and many private universities.
Is an 800 a good SAT score?
No, 800 is well below the national average of 1028 and falls in the below-average tier, roughly equivalent to a 14 on the ACT.
What SAT score is in the top 1%?
A score of approximately 1540 and above typically places a student in the top 1% of all SAT test takers nationally.
What is Mark Zuckerberg’s SAT score?
Mark Zuckerberg’s SAT score has never been publicly released or confirmed, so there is no verified figure to cite.
Has anyone gotten 100% on the SAT?
Yes, a small number of students achieve a perfect 1600 score each year, though it represents a very small fraction of total test takers.
Did Bill Gates get a 1600 on the SAT?
No. Bill Gates has been widely reported and self-referenced as scoring 1590 out of a possible 1600 on the pre-1995 SAT scale, not a perfect 1600. This figure is self-reported rather than officially released by College Board.
What is Jeff Bezos’ SAT score?
Jeff Bezos has referenced scoring 1450 on the SAT in a published interview. As with other public figures, this is self-reported rather than officially confirmed by College Board.
Is 1500 SAT too low for MIT?
1500 sits below MIT’s typical 1520-1570 range, so it’s somewhat below their usual middle 50%, though MIT reviews applications holistically and a strong overall application can still be competitive.
What is the lowest SAT score admitted to Harvard?
Harvard’s typical published range is 1510 to 1580 for the middle 50% of admitted students, meaning roughly a quarter of admits score below 1510, though Harvard does not publish an absolute minimum score.
Has anyone gotten a 1600 on the SAT?
Yes, a small number of students achieve a perfect 1600 every testing year, though the exact number varies annually and represents a very small percentage of total test takers.
Frequently Asked Questions
Scoring Basics
What is the highest possible SAT score?
The highest possible SAT score is 1600, made up of a maximum 800 on Reading and Writing and a maximum 800 on Math.
What is the lowest possible SAT score?
The lowest possible SAT score is 400, made up of a minimum 200 on each of the two sections.
Is the SAT out of 1600 or 2400?
The current SAT is scored out of 1600. The 2400 scale, which included a separate essay section, was used before 2016 and no longer applies.
How many times can I take the SAT?
There’s no official College Board limit on how many times you can take the SAT, though most students take it two or three times, and individual colleges may have their own policies on which scores they’ll consider.
Good Score by Goal
What SAT score do I need for a full-ride scholarship?
This varies significantly by school and scholarship program, but many merit scholarship thresholds start around 1350 to 1400 and increase from there, with the most competitive full-ride programs often looking for 1500 or higher.
What SAT score do I need for a state school?
Most state flagship universities have typical admitted ranges somewhere between 1100 and 1350, though this varies significantly between individual state schools, with some flagships considerably more selective than others.
Does a low SAT score mean I won’t get into college?
No. A lower SAT score limits your options at the most selective schools, but the majority of four-year colleges in the U.S. admit the majority of their applicants, and many schools are now test-optional, meaning your score doesn’t have to be part of your application at all.
Colleges & Admissions
Do all colleges require SAT scores?
No, a large and growing number of colleges are test-optional, meaning you can choose whether to submit your SAT score as part of your application.
Should I submit my SAT score if the school is test-optional?
Generally, if your score is at or above the school’s published middle 50% range, submitting it can strengthen your application. If it’s below that range, many students choose to withhold it, though this depends on the rest of your application profile.
Does SAT score matter more than GPA?
Most selective colleges use holistic review, meaning GPA, course rigor, essays, extracurriculars, and test scores are all considered together rather than any single factor determining admission on its own.
Digital SAT
Is the digital SAT easier than the paper SAT?
The digital SAT isn’t easier or harder overall, it’s adaptive and shorter than the old paper test, with shorter reading passages and a calculator allowed throughout the math section.
How long is the digital SAT?
The digital SAT takes about 2 hours and 14 minutes total, shorter than the previous paper-based version of the test.
Sending & Logistics
How long does it take to get SAT scores?
SAT scores are typically available within about two weeks of your test date through your College Board account, though exact timing can vary by test date.
Is there a fee to send SAT scores to colleges?
Yes, there is generally a fee per college for sending official score reports, though a limited number of free score sends are typically included when you register for the test. Check the College Board’s official score-sending page for current pricing.
What is Score Choice?
Score Choice is a College Board feature that lets you choose which test date’s scores to send to each college, rather than being required to send every score from every time you’ve taken the test. Some colleges still require you to submit all scores regardless, so it’s worth checking individual school policies.