i-Ready Diagnostic Scores by Grade 2027: Placement Bands for Math and Reading
An i-Ready scale score runs from 100 to 800, and what it means depends on the grade of the student who scored it. The tables below give the placement band for every grade in both subjects, as real figures rather than a chart image.
That last point is not a boast, it is the reason this page exists. Almost every i-Ready score chart online, including some on large sites, publishes a single column of score ranges as though a 500 meant the same thing for a third grader and a seventh grader. It does not.
| A scale score of 700 in reading | For a student in | Places at |
|---|---|---|
| 700 | Grade 3 | Grade 6 |
| 700 | Grade 5 | Grade 8 |
| 700 | Grade 8 | Grade 9 |
The same score is a different placement at different grades, because the comparison is to the student’s own grade.
i-Ready mathematics placement by grade
| Student grade | Two or more grade levels below | One grade level below | On grade level | Above grade level |
|---|---|---|---|---|
| K | n/a | 100 to 361 | 362 to 454 | 455 to 800 |
| 1 | 100 to 346 | 347 to 401 | 402 to 496 | 497 to 800 |
| 2 | 100 to 386 | 387 to 427 | 428 to 506 | 507 to 800 |
| 3 | 100 to 412 | 413 to 448 | 449 to 516 | 517 to 800 |
| 4 | 100 to 433 | 434 to 464 | 465 to 526 | 527 to 800 |
| 5 | 100 to 449 | 450 to 479 | 480 to 540 | 541 to 800 |
| 6 | 100 to 464 | 465 to 494 | 495 to 564 | 565 to 800 |
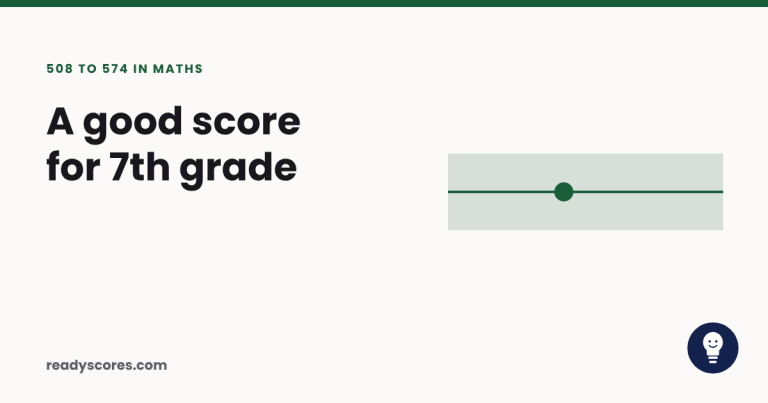
| 7 | 100 to 479 | 480 to 507 | 508 to 574 | 575 to 800 |
| 8 | 100 to 492 | 493 to 517 | 518 to 585 | 586 to 800 |
Curriculum Associates, i-Ready Diagnostic Grades K-12 Scale Score Placement Tables. Publisher documentation. Overall placement bands; the band depends on the student’s own grade as well as the score.
i-Ready reading placement by grade
| Student grade | Two or more grade levels below | One grade level below | On grade level | Above grade level |
|---|---|---|---|---|
| K | n/a | 100 to 361 | 362 to 479 | 480 to 800 |
| 1 | 100 to 346 | 347 to 433 | 434 to 536 | 537 to 800 |
| 2 | 100 to 418 | 419 to 488 | 489 to 560 | 561 to 800 |
| 3 | 100 to 473 | 474 to 510 | 511 to 602 | 603 to 800 |
| 4 | 100 to 495 | 496 to 556 | 557 to 629 | 630 to 800 |
| 5 | 100 to 541 | 542 to 580 | 581 to 640 | 641 to 800 |
| 6 | 100 to 565 | 566 to 597 | 598 to 653 | 654 to 800 |
| 7 | 100 to 582 | 583 to 608 | 609 to 669 | 670 to 800 |
| 8 | 100 to 593 | 594 to 619 | 620 to 684 | 685 to 800 |
Curriculum Associates, i-Ready Diagnostic Grades K-12 Scale Score Placement Tables. Publisher documentation. Overall placement bands; the band depends on the student’s own grade as well as the score.
How to use these tables
If you only need the on grade level threshold, that one band is pulled out separately for every grade and subject.
Find the row for your child’s current grade, then find which column their scale score falls into. That is the placement the report is describing when it says On Grade Level or Two or More Grade Levels Below.
The four columns tile the whole scale with no gaps, so every possible score lands in exactly one of them. A kindergarten row has no two or more below column because there is nothing two grade levels below kindergarten.
The i-Ready score calculator will do the lookup for a specific figure, and the placement levels page explains what each label means for teaching.
The band widths are not equal, and it matters
The on grade level band is 95 points wide in grade 1 maths and 61 points wide in grade 5. In reading it narrows from 118 points in kindergarten to 56 in grade 6.
So the same 10 point gain can move a child across a placement boundary in one grade and barely register in another. This is worth knowing before reading a placement change as progress or decline: in the middle grades, where bands are narrow, a placement can flip on a difference that is within the ordinary noise of a single test session.
Read the scale score itself across diagnostics rather than the label. The growth tracker compares scores rather than bands for this reason.
The on grade band itself subdivides into Early, Mid and Late, which the four column view above does not show. Those sub-bands are set out for reading and for mathematics, along with the high school pathway tables.
Placement is not the same as a percentile
Two different questions, and families conflate them constantly.
A placement band answers what grade level of material the score corresponds to. A percentile answers how the student compares to other students in the same grade. A child can be on grade level and at the 40th percentile, because on grade level is a content judgement and the percentile is a ranking.
For the percentile side, the maths chart by grade and the reading chart by grade carry percentile tables for autumn, winter and spring. This page is the placement side, and the two are complementary rather than alternatives.
What we would read first on the report
Not the overall placement. The domain breakdown underneath it.
An overall band is an average across domains, and a single soft domain can pull a whole placement down while everything else is solid. That is a specific, fixable thing, and it is invisible in the headline label. The reverse also happens: an on grade level overall can hide one domain that is two years behind.
We say this because of what arrives in our inbox. The messages are almost always about the overall label, and the answer is almost always in the domains. What to do after the score report goes through the rest of it.
If the overall came in below grade, one grade level below is often a smaller gap than it sounds, and the exact distance to the on grade band is usually a matter of a few dozen points.
Where these numbers come from
Curriculum Associates’ own published scale score placement tables, the vendor’s documentation rather than a third party chart. We validate the transcription by checking that every grade’s bands run contiguously from 100 to 800 with no gap or overlap, which catches a mistyped digit, and we cross checked one band against a later edition of the same document.
Our methodology sets out the process. The full set of test score charts covers the other assessments, the i-Ready diagnostic scores overview explains the test itself, and readyscores.com/ is the place to start with a report in hand.
Common questions
What is a good i-Ready diagnostic score by grade?
A score inside the on grade level band for your child’s grade. In maths that is 449 to 516 in grade 3 and 518 to 585 in grade 8; in reading it is 511 to 602 in grade 3 and 620 to 684 in grade 8. The full tables are on this page.
What does the i-Ready scale score mean?
It places a student on a single scale running from 100 to 800 that spans all grades. The score on its own is not interpretable: it has to be read against the bands for the student’s own grade, which is what the tables here do.
Is the i-Ready score chart the same for every grade?
No, and this is the most common error. The same scale score is a different placement at different grades, so any chart with one column of score ranges is wrong for most children reading it.
What is the highest i-Ready score?
800 in both reading and mathematics. It is a scale ceiling rather than a realistic result, and the top placement band for a grade 8 student starts at 611 in maths and 724 in reading.
Are these percentiles?
No. These are placement bands, which answer what grade level of material a score corresponds to. Percentiles answer where a student stands against other students, and they are a separate set of figures on the subject chart pages.